

Bounce Rate vs Exit Rate: Key Differences Explained
When it comes to analyzing your website’s performance, bounce rate and exit rate are two critical metrics that can provide valuable insights into user behavior. For content-focused pages such as blogs or news sites, it is expected to see exit rates in the range of 70% to 80%. In contrast, for key ecommerce pages like product listings or checkout, an ideal exit rate falls between 20% to 40%.
While both metrics measure exits, they offer distinct perspectives on how visitors interact with your site. Understanding the differences between bounce rate and exit rate can help you identify potential issues and optimize the user journey, improving engagement, conversions, and overall site effectiveness.
In this blog, we will dive into the key differences between bounce rate and exit rate, learn how to interpret these metrics, and discover strategies to reduce both rates for better website performance.
Quick Glance
- Bounce rate measures the percentage of visitors who leave your site after viewing just one page, indicating how well your landing pages capture attention.
- Exit rate tracks the percentage of visitors who leave from any page, regardless of how many pages they have visited, helping identify where users tend to drop off in their journey.
- While bounce rate reflects initial user engagement, exit rate highlights where users leave within their session, often pointing to issues in the conversion funnel.
- Reducing bounce rate involves improving content relevance, enhancing navigation, and aligning landing page content with user expectations.
- To lower exit rate, optimize your conversion paths, simplify user journeys, and provide clear calls-to-action to guide users toward completing desired actions.
Let’s start with the basics.
What is Bounce Rate?
Bounce rate refers to the percentage of visitors who land on a webpage and leave without interacting further, such as by navigating to other pages on the site. In simpler terms, a "bounce" happens when a user enters a webpage and exits immediately after viewing just one page.
This metric is particularly valuable in evaluating how well your landing pages perform in engaging users right from the start. A high bounce rate could indicate issues with content relevance, user experience, or poor targeting, suggesting that visitors didn’t find what they expected or didn’t see a reason to engage further.
What is Exit Rate?
Exit rate measures the percentage of users who leave your website from a particular page, regardless of how many pages they’ve visited during their session. An exit occurs when users finish their visit on that page, which could be after exploring multiple pages or engaging with various parts of the site.
The exit rate provides insights into where visitors tend to leave, and this is critical for analyzing the final steps of the user journey. While the exit rate measures departures, it doesn’t imply dissatisfaction or abandonment. It simply tells you the last point where users ended their session.
Significance of Bounce Rate and Exit Rate in Assessing User Engagement
Both bounce rate and exit rate are essential metrics for understanding user behavior, but they provide different types of insights into website performance and user engagement.
Bounce Rate Insights:
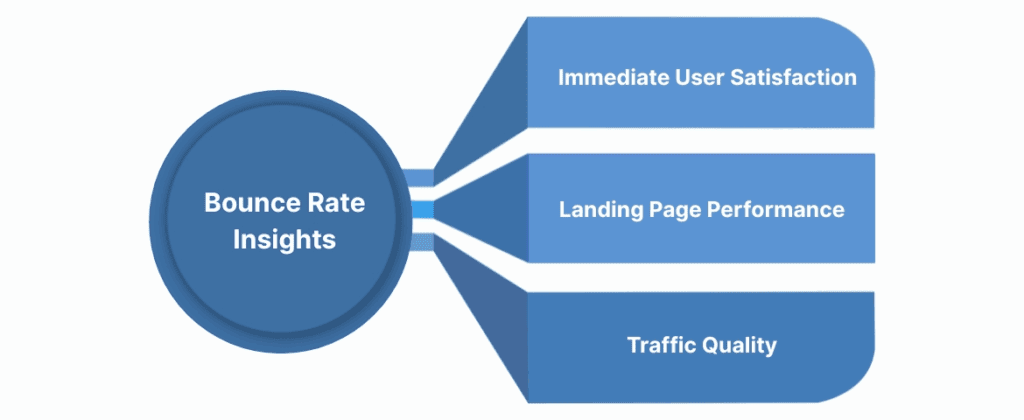
- Immediate User Satisfaction: Bounce rate reflects how well a page captures user attention upon the first interaction. A high bounce rate often suggests that the content isn’t aligned with user expectations, or the page may not be compelling enough to explore further.
- Landing Page Performance: If a page with a high bounce rate is a key entry point (such as a homepage or campaign landing page), it indicates that visitors aren’t finding what they were expecting, which can negatively impact conversions.
- Traffic Quality: Bounce rate can also give insight into the quality of traffic. If the traffic source isn’t relevant (e.g., an ad or keyword targeting the wrong audience), users may not engage and immediately leave.
If your landing page is not engaging visitors, Ingest IQ can help you understand how users interact with your site, enabling you to optimize content and design for better results.
Exit Rate Insights:
- User Journey and Conversion Funnel: The exit rate highlights where in the customer journey users are leaving. A high exit rate on a particular page, such as a checkout or contact page, might suggest friction or obstacles in the conversion path that are causing users to abandon the process.
- Content or Flow Effectiveness: It can show whether users are engaging deeply with your content or leaving early due to poor navigation, long forms, or confusing layout.
- Page-Specific Problems: If a specific page has an unusually high exit rate, it may need attention, either because it’s underperforming in terms of content, functionality, or because there is a bottleneck in the conversion process.
To optimize your conversion funnel and reduce exits, Ingest Labs’ Event IQ helps you measure and track user behavior, giving you actionable insights into improving the customer journey.
In summary, bounce rate helps assess whether users are engaged from the moment they land on your page, while exit rate provides insights into how the final touchpoints in a user’s journey affect conversions and retention. Both are crucial for making data-driven decisions aimed at improving website user experience and maximizing conversions.
Next, let’s learn how to calculate bounce rate and exit rate.
How to Calculate Bounce Rate and Exit Rate?
Understanding how to calculate bounce rate and exit rate is key to interpreting these metrics effectively. Let's break down the formulas for each metric and provide examples to clarify how they are calculated.
Calculating Bounce Rate
Bounce rate is calculated by dividing the number of single-page visits (bounces) by the total number of entries or sessions to the page.
Bounce Rate Formula:
Bounce Rate = (Single Page Visits / Total Entries) × 100
Let's say you have a landing page with 1,000 visitors. Out of these, 300 leave the page without clicking any other links or interacting with other pages on the website (this is considered a bounce).
Bounce Rate Calculation:
Bounce Rate = (300 / 1,000) × 100 = 30%
So, the bounce rate for this page would be 30%, meaning that 30% of the visitors left after viewing just that one page.
Calculating Exit Rate
Exit rate measures the percentage of visitors who leave your site from a specific page, after viewing one or more other pages. This formula is calculated by dividing the number of exits from a page by the total number of views of that page.
Exit Rate Formula:
Exit Rate (%) = (Exits from Page / Total Page Views) × 100
Imagine you have a product page with 500 views, and 150 visitors exit the page after viewing it.
Exit Rate Calculation:
Exit Rate = (150 / 500) × 100 = 30%
The exit rate for this page would be 30%, meaning 30% of the people who viewed the product page left the site from that page.
We have now seen how both metrics are calculated, but understanding how they differ is essential for optimizing your webpages.
Differences Between Bounce Rate and Exit Rate
While both bounce rate and exit rate are metrics used to measure user exits, they track different aspects of user behavior. Let’s break down the key differences in a table.
| Metric | Bounce Rate | Exit Rate |
| Focus | Measures visitors who leave after viewing just one page. | Measures visitors who leave after visiting multiple pages. |
| Page Type | Applies to single-page visits. | Applies to any page, whether it’s the first or last page. |
| Indication | High bounce rate suggests poor landing page engagement or content mismatch. | High exit rate suggests issues in the conversion path or friction points. |
| User Journey | Focuses on the first interaction and whether the page engages visitors. | Focuses on the final interaction and where visitors leave in their session. |
| Calculation | Bounce Rate = (Single Page Visits / Total Entries) × 100 | Exit Rate = (Exits from Page / Total Page Views) × 100 |
It’s important to note that all bounces are exits, but not all exits are bounces.
- Bounce Example: A user visits your homepage, finds no relevant content, and leaves without clicking any links or visiting additional pages. This visit is considered both a bounce and an exit.
- Exit Example: A user visits your homepage, navigates to a product page, then leaves the site from the product page after exploring it. This visit would be counted as an exit, but not as a bounce since the user engaged with multiple pages before leaving.
This distinction is key to understanding the difference between these two metrics. A bounce is a very specific type of exit—one that happens right after the first page visit.
Understanding these differences is critical for optimizing your website. Ingest Labs’ Event IQ can help you understand how these metrics impact your site performance, offering deeper insights for effective decision-making.
Typical Use Cases for Bounce Rate vs Exit Rate
Now that we have covered the differences, it is time to look at real-world use cases for bounce rates and exit rates. This will help you understand when to focus on bounce rate or exit rate to solve specific problems on your website.
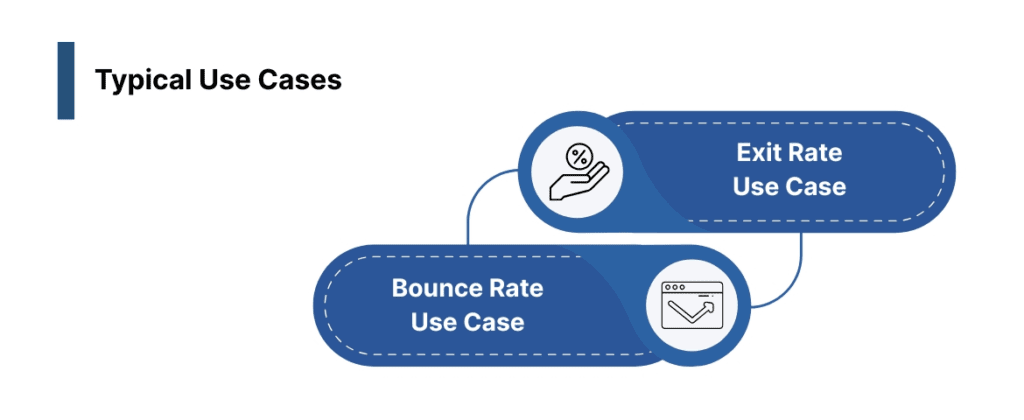
Bounce Rate Use Case
Identifying Landing Page Issues: If a page has a high bounce rate, it may need optimization. This could mean adjusting the content to better align with the visitor’s intent, improving page design, or making the page more interactive.
Testing Traffic Quality: High bounce rates may indicate poor-quality traffic that doesn’t match your intended audience, suggesting the need for better targeting or content adjustment.
Exit Rate Use Case
Funnel Optimization: A high exit rate on pages like checkout, contact forms, or subscription pages suggests bottlenecks in the conversion process. It’s an opportunity to simplify the process, add trust signals, or improve content clarity.
Content or Design Improvements: Exit rate is useful in identifying which pages users leave the most. You can optimize these pages by improving content quality, simplifying design, or enhancing user flow.
Armed with a better understanding of bounce rate and exit rate, it’s time to look at actionable strategies to reduce these rates.
Strategies to Reduce Bounce Rates
Reducing bounce rate is crucial for enhancing user engagement and improving overall site performance. Here are some strategies to reduce bounce rate:
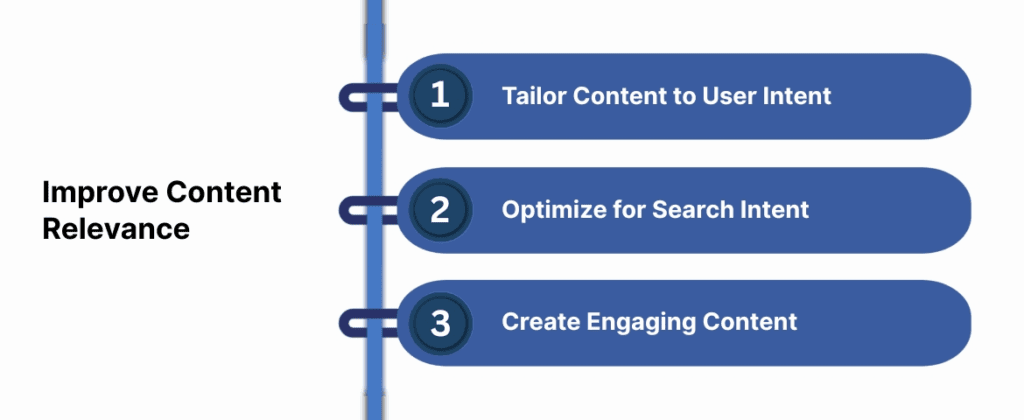
1. Improve Content Relevance
When visitors land on your page, the content must meet their expectations. If they don’t find what they’re looking for, they will leave quickly. What can be done here? Let’s see.
- Tailor Content to User Intent: Ensure that the content on your landing pages matches the keywords and expectations that brought users there in the first place. For example, if visitors are searching for a specific product, ensure that your product descriptions, images, and pricing information are clear and relevant.
- Optimize for Search Intent: Use tools like Google Search Console and keyword research to understand the terms your audience is searching for and align your content accordingly.
- Create Engaging Content: Include relevant blog posts, product videos, or interactive elements that encourage visitors to explore more of your site. Providing multimedia content like videos, infographics, or case studies can enhance user engagement.
2. Enhance Navigation
If users cannot easily find their way around your website, they may leave without exploring other pages. Here is what you can do:
- Clear Site Structure: Simplify your site’s navigation. Ensure that your menu items are organized logically and that users can easily navigate between sections. This might involve creating dropdown menus, adding a search bar, or categorizing content based on user needs.
- Internal Linking: Use internal links to guide visitors to other relevant content. If they find something interesting, they’ll be more likely to stay longer and interact with more pages on your site.
- Responsive Design: Ensure that your website is optimized for mobile devices. Since mobile traffic is a significant part of website traffic, ensuring that your site loads quickly and functions well on mobile can significantly reduce bounce rates.
Ingest IQ helps improve user engagement by analyzing first-party data and optimizing content flow, reducing bounce rates effectively.
Also Read: Understanding and Implementing Campaign Optimization
Strategies to Reduce Exit Rates
Reducing the exit rate is essential for ensuring that users move through your conversion funnel and take the desired actions. Here’s how you can improve your exit rate:
1. Optimize Conversion Paths
The fewer obstacles there are in the conversion path, the more likely users will follow through to the end. Focus on streamlining the journey and minimizing friction.
- Simplify Forms: Complex or lengthy forms can frustrate users and cause them to abandon the process. Reduce form fields to the essentials, and use features like auto-fill to speed up the process.
- Clarify Next Steps: Let users know what to expect next in the process. Whether it’s a confirmation page after a purchase or a “Thank You” message, having clear steps and expectations can reduce exits.
- Reduce Page Load Time: Long load times on checkout pages or forms can be a major reason for exit. Make sure your pages load quickly by optimizing images, leveraging browser caching, and using a Content Delivery Network (CDN).
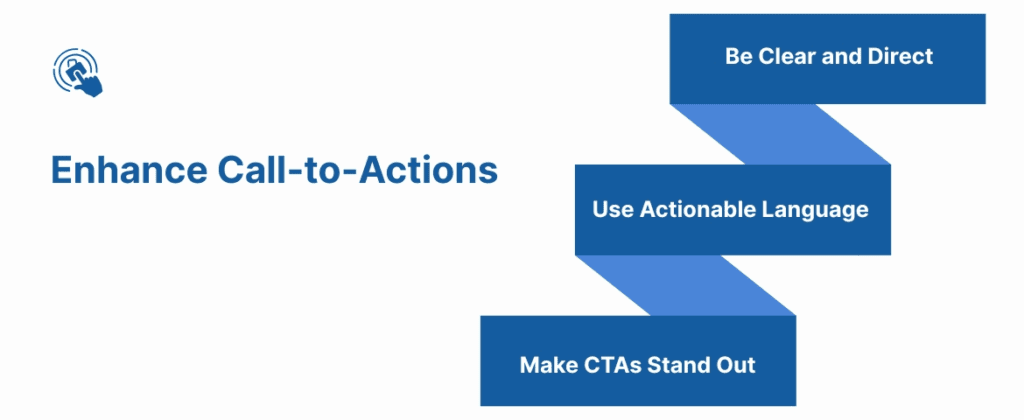
2. Enhance Call-to-Actions
A well-placed, compelling call-to-action (CTA) can make a significant difference in reducing exit rates, especially on pages where users might otherwise leave.
- Be Clear and Direct: Your CTA should clearly communicate what action you want the user to take. Whether it’s “Add to Cart,” “Learn More,” or “Sign Up,” the CTA should leave no room for confusion.
- Use Actionable Language: CTAs like "Get Started," "Join Now," or "Claim Your Offer" encourage action and create a sense of urgency.
- Make CTAs Stand Out: Position your CTAs prominently on the page (preferably above the fold) and use contrasting colors or buttons to draw attention.
After exploring strategies to reduce both bounce and exit rates, it’s essential to measure the effectiveness of these changes. Tracking these metrics accurately allows you to assess the impact of your optimizations and identify areas that still need improvement. Google Analytics provides an easy and efficient way to monitor bounce and exit rates, helping you make data-driven decisions to enhance user engagement. Let’s take a look at how you can track these key metrics using Google Analytics.
How to Track Bounce and Exit Rates Using Google Analytics
Google Analytics provides a simple and efficient way to track both bounce rates and exit rates. Here’s how to measure them:
Tracking Bounce Rate
- Navigate to the Audience Section: In Google Analytics, go to the "Audience" section, then click "Overview." The bounce rate will be displayed in the report as a percentage of single-page sessions.
- Tracking by Page: To see bounce rates by specific pages, go to "Behavior" > "Site Content" > "All Pages." Here, you can view bounce rates for individual pages and assess which ones are underperforming.
Tracking Exit Rate
- View Exit Data for Pages: Exit rates are tracked under "Behavior" > "Site Content" > "All Pages." This report shows the percentage of users who exited from each specific page.
- Custom Reports: You can create custom reports in Google Analytics to track exit rates by specific segments or across different dimensions, such as traffic sources or user behavior.
Also Read: How to Track Conversions in Google Analytics 4
Importance of Real-Time Monitoring Tools for Deeper Insights
While Google Analytics is incredibly useful for tracking overall trends, real-time monitoring tools can provide immediate insights into how visitors are interacting with your site, allowing you to make adjustments and optimize the user experience on the fly.
Why Real-Time Monitoring Matters:
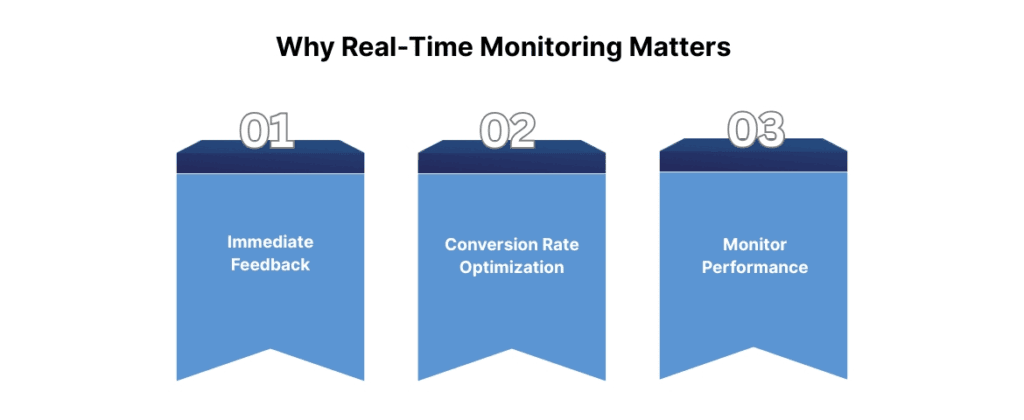
- Immediate Feedback: Real-time data allows you to spot issues instantly, such as a sudden spike in bounce rates after launching a new page or campaign. You can immediately investigate and resolve any technical or content-related issues that could be causing visitors to leave.
- Conversion Rate Optimization: Real-time monitoring enables you to test new features, layouts, or CTAs and track their performance as users interact with them, allowing you to optimize your conversion paths instantly.
- Performance Monitoring Across Channels: Real-time data helps you measure the performance of traffic from different channels (e.g., social media, paid ads, organic search) as they land on your site. This insight helps you identify which channels are performing well and which need attention.
Recommended Real-Time Tools:
- Hotjar: For session recordings, heatmaps, and real-time user behavior insights.
- Crazy Egg: Provides real-time visual reports of user behavior, helping you optimize page layouts and content.
- Google Analytics Real-Time Reports: Allows you to track user activity in real time and see how visitors are interacting with your site immediately.
By using real-time monitoring alongside Google Analytics, you can quickly identify patterns, resolve issues, and continuously improve the user experience on your site, ultimately reducing bounce and exit rates.
Conclusion
Understanding and interpreting bounce rate and exit rate metrics is essential for optimizing user engagement and improving website performance. By analyzing these metrics in context and using the insights to inform content and design improvements, you can enhance user experience, reduce friction points, and ultimately increase conversions.
If you're ready to take your website’s performance to a whole new level, Ingest Labs is here to help. Our tailored strategies, powered by tools like Ingest IQ and Event IQ, allow you to optimize user interactions, improve engagement, and maximize conversions with data-driven solutions.
Take control of your website’s success. Contact Ingest Labs today for tailored strategies and data-driven solutions to boost engagement and conversions!
FAQs
1. What is the difference between bounce rate and exit rate?
Bounce rate measures the percentage of visitors who leave your site after viewing only one page, while exit rate tracks the percentage of visitors who leave your site from any given page, regardless of how many pages they visited.
2. How do I reduce my bounce rate?
To reduce bounce rate, improve the relevance of your content, enhance navigation, speed up your website, and ensure that your landing pages align with user expectation
3. What causes high exit rates on certain pages?
High exit rates on specific pages may indicate friction points, such as complicated forms, unclear calls to action, or user dissatisfaction. Reviewing and optimizing these pages can help reduce exit rates.
4. Should I be concerned if my exit rate is high on a thank-you or confirmation page?
Not necessarily. A high exit rate on confirmation pages is often a sign that users have completed their desired action (e.g., made a purchase or filled out a form), which is a positive outcome.
5. How can I track bounce and exit rates?
Both bounce rate and exit rate can be tracked using Google Analytics. Bounce rate can be found under "Audience Overview," while exit rate data can be accessed under "Behavior > Site Content > All Pages."
6. How can I improve my exit rate on checkout or product pages?
To reduce exit rates on checkout or product pages, simplify forms, improve clarity on pricing, streamline navigation, and include trust signals like secure payment options and customer reviews.