

Every website has a purpose: generating sales, collecting leads, or encouraging engagement. Measuring how effectively a site achieves that goal is what defines its success. The web conversion rate tells you how well your website turns visitors into customers or leads.
Understanding this metric helps marketing teams pinpoint what works, what does not, and where optimization can make a measurable difference. For data-driven organizations, accuracy in calculating and tracking conversions is essential.
In this guide, we will explore what a web conversion rate is, how to calculate it, what influences it, and how platforms like Ingest Labs help ensure every conversion is captured correctly.
Key Takeaways
- Conversion rate tells you how effectively your website turns visitors into measurable actions like purchases or sign-ups.
- Benchmarks vary by industry, traffic source, and device, but 2–4% is typical for many websites.
- The biggest mistake? Relying on incomplete analytics, accurate data requires server-side and first-party tracking.
- With Ingest Labs’ tools, marketers can track, analyze, and improve conversion rates confidently, even in a cookieless world.
What Is a Web Conversion Rate?
A web conversion rate measures the percentage of website visitors who complete a desired action, also known as a conversion. These actions can vary depending on your business model or objective.
Common Examples of Conversions
- Making a purchase
- Filling out a contact or signup form
- Downloading a resource or app
- Booking a demo or appointment
- Subscribing to a newsletter
In simple terms, the conversion rate reflects how well your website encourages users to act. It’s a direct indicator of website performance and marketing effectiveness.
Why It Matters
- Helps measure ROI for campaigns and content strategies.
- Identifies bottlenecks in the customer journey that prevent users from taking action.
- Shows how design, messaging, and audience quality influence results.
- Provides a baseline for A/B testing and continuous improvement.
In short, a higher conversion rate means more visitors are completing valuable actions, signaling that your website and campaigns are aligned with user intent.
Also Read: How to Track Conversions in Google Analytics 4
How to Calculate Web Conversion Rate
The web conversion rate formula is simple but powerful. It connects total visitor activity with your desired business outcome.
Conversion Rate (%) = (Number of Conversions / Total Visitors) * 100
Example:
If your website receives 5,000 visitors in a month and 250 complete a purchase, your conversion rate is:
=> (250 ÷ 5,000) × 100 = 5%
That means 5% of all visitors completed the goal action.
Tip: Always define what counts as a conversion before measuring. Using Ingest Labs’ tools ensures these metrics stay accurate across devices and channels, even when cookies are blocked.
Types of Conversions: Micro vs. Macro
Not every conversion carries the same weight. Some actions directly contribute to revenue, while others build toward a larger goal.
Understanding the difference between macro-conversions and micro-conversions helps you evaluate both immediate and long-term success.
1. Macro-Conversions
These represent the primary goals of your website, the actions that have a direct business impact.
Examples:
- A completed product purchase
- A booked demo or consultation
- A submitted quote request
- A subscription signup
Why They Matter: Macro-conversions directly measure performance and return on investment. They tell you whether your marketing campaigns are generating actual business outcomes.
2. Micro-Conversions
Micro-conversions are smaller, supportive actions that move users closer to a macro-conversion. They indicate engagement and buying intent but may not immediately lead to revenue.
Examples:
- Adding items to a cart
- Watching a product video
- Signing up for a newsletter
- Downloading a whitepaper or case study
Why They Matter: Tracking micro-conversions helps identify early engagement signals. It gives marketers insight into what influences users before they make the final decision.
Tip: Accurate tracking of both conversion types ensures a complete view of your performance funnel. With Ingest Labs, marketers can monitor both in real time, ensuring no valuable data is lost due to browser restrictions or ad blockers.
Also Read: Understanding and Optimizing Conversion Funnels in Digital Marketing
What Affects Web Conversion Rate: Key Variables to Watch
Multiple factors influence your web conversion rate, some related to user experience, others tied to audience behavior or data quality. Recognizing these variables helps prioritize what to test and optimize first.
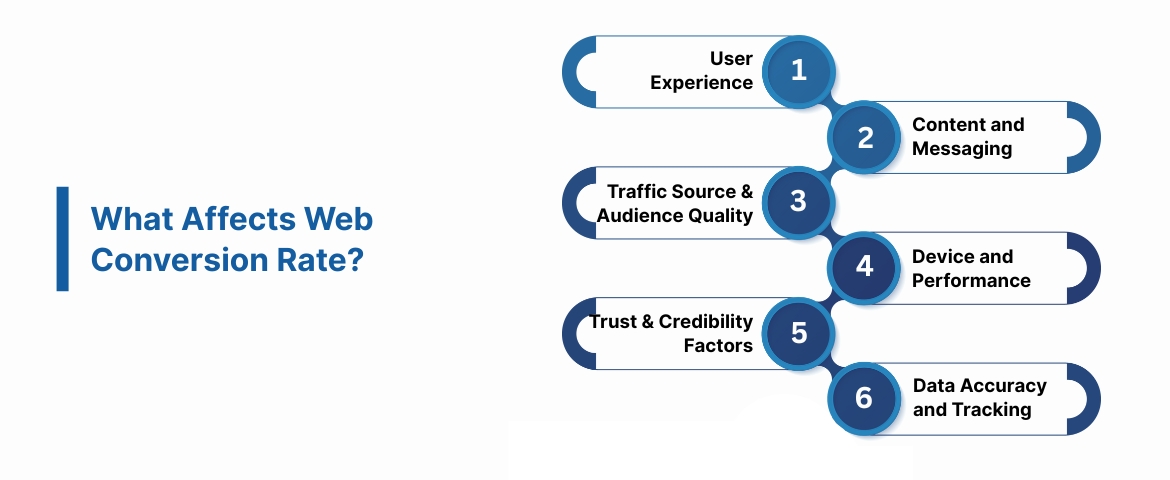
1. User Experience (UX)
A smooth, intuitive website builds trust and encourages action.
- Simplify navigation to reduce cognitive load.
- Ensure page layouts are clean and mobile-friendly.
- Use clear and visible calls to action (CTAs).
Data Insight: Studies show that reducing form fields from four to three can increase conversion rates by over 50%.
2. Content and Messaging
The clarity and relevance of your message directly affect engagement.
- Use value-driven headlines and concise copy.
- Align offers and CTAs with user intent.
- Personalize messaging using behavioral data from Ingest ID to ensure users see what matters to them.
3. Traffic Source and Audience Quality
Not all traffic converts equally. Visitors from paid campaigns often behave differently from organic or referral visitors.
- Analyze conversion rate by channel (search, email, social).
- Use attribution insights from Ingest IQ to track where high-quality users originate.
- Adjust ad targeting and landing page relevance accordingly.
4. Device and Performance
Website conversion rates vary across devices and platforms.
- Mobile visitors typically have shorter attention spans but higher browsing frequency.
- Optimize load times; each additional second of delay can reduce conversions by up to 7%.
- Test forms, buttons, and visuals across devices.
5. Trust and Credibility Factors
Users are more likely to convert when they feel secure.
- Include clear return or refund policies.
- Display verified customer reviews.
- Use visible security badges for checkout or data submission pages.
6. Data Accuracy and Tracking
Even small tracking issues can distort conversion data.
- Ensure server-side tracking through Ingest IQ for more reliable event capture.
- Use Event IQ to verify data integrity and identify missing conversion signals.
- Maintain GDPR and CCPA compliance through Ingest Labs’ privacy-first setup.
| Factor | Impact on Conversion Rate | Optimization Example |
| User Experience | Reduces friction and increases engagement | Simplify form design |
| Messaging | Aligns value proposition with intent | Test CTAs and headlines |
| Traffic Quality | Focuses on profitable channels | Analyze by source using Ingest IQ |
| Device & Speed | Enhances accessibility | Optimize load times and mobile UI |
| Trust | Builds user confidence | Add testimonials and policies |
| Tracking Accuracy | Ensures reliable data for decisions | Implement Event IQ verification |
Conversion success depends not only on strong marketing but also on accurate data. With Ingest Labs’ privacy-safe analytics and unified tracking, businesses can isolate performance gaps confidently and act on verified insights.
What Is a Good Conversion Rate? Benchmarks & Industry Averages
Determining a “good” web conversion rate depends heavily on your industry, traffic quality, device mix, and business goals. Below are recent data points and benchmarks, useful as broad reference points rather than rigid targets.
Recent Industry Benchmarks
| Source / Study | Typical Conversion Rate (Overall / E-commerce / Website-wide) |
| Global analysis of ecommerce sites (many brands, multi-device) 2024 data | Overall conversion rate around 3.06% |
| Broad-industry benchmark across 14 sectors (leads, sales, forms, etc.) 2025 | Average conversion rate ~ 2.9% |
| Recent e-commerce-focused report (2023) | Average ~3.65% for ecommerce sites |
| General benchmark across industries and site types | Typical range often falls between 1.8% and 3.7%, depending on context |
Interpreting the Benchmarks
- A conversion rate around 2%–4% is often seen as “average” for many ecommerce and general websites.
- Rates above 4%–5% may indicate strong performance when user experience, targeting, and value proposition align well.
- Lower rates (below 1.5%–2%) don’t automatically mean failure; they may reflect high-complexity offerings, niche audiences, or long decision-cycles (e.g. B2B, high-value products).
Why Benchmarks Are Only a Starting Point
- Industry variation: A high-frequency consumer goods store will usually see stronger conversion rates than a niche B2B software provider.
- Traffic source & quality: Organic search, email, paid ads, referrals; each source often performs differently.
- User device & journey complexity: Mobile traffic can underperform vs desktop; multi-step sales cycles reduce immediate conversion rates.
- Definition of “conversion”: Whether you count micro-conversions (newsletter sign-ups, downloads) or only macro-conversions (sales) dramatically affects the rate.
As a result, the best benchmark is your own historical conversion rate, against which you can track improvement.
Also Read: Different Methods of Ads Conversion Tracking for Websites
Why Accurate Tracking Matters: Data Integrity & Proper Attribution
Conversion rate benchmarks are only useful if the underlying data is accurate. Without reliable tracking and proper attribution, reported rates can mislead decisions or mask problems.
Common Tracking Challenges
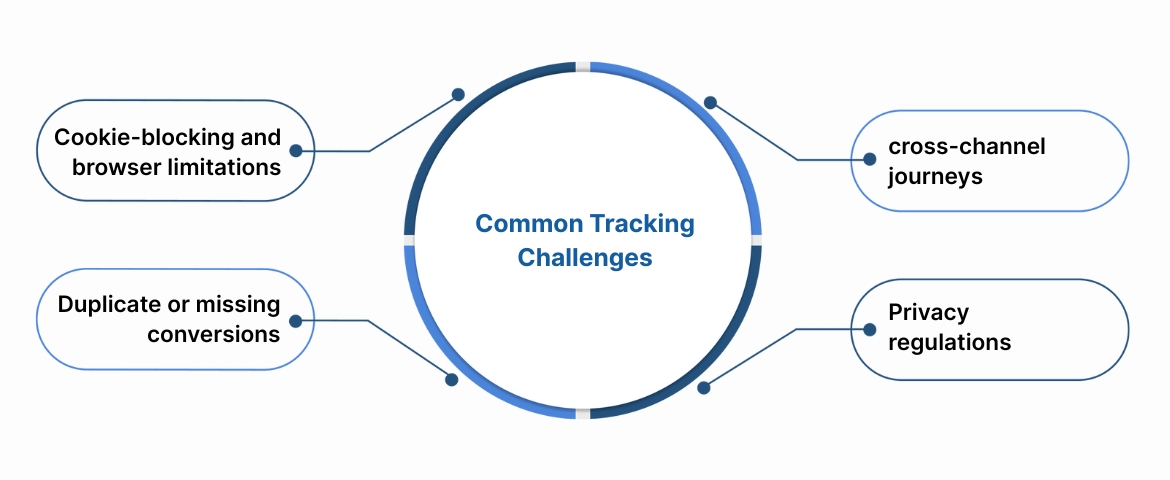
- Cookie-blocking and browser limitations: Many third-party tracking methods are blocked or restricted, causing missed conversions or incomplete data.
- Cross-device and cross-channel journeys: Users may click an ad on mobile, browse on desktop, and convert on another device, making attribution tricky.
- Duplicate or missing conversions: Improper tag setup, missing events, or fragmented analytics increase error margins.
- Privacy regulations (GDPR, CCPA): Legal constraints can limit data collection, making traditional tracking unreliable or non-compliant.
Why Reliable, Privacy-Compliant Tracking Is a Must
- Ensures all conversions are captured, irrespective of device, channel, or browser policies.
- Provides clean, unified data that connects user actions consistently, useful for accurate calculation and insights.
- Enables data-driven decisions based on real performance, not estimates or partial data.
- Helps comply with privacy laws and retain customer trust, critical for long-term brand integrity.
Also Read: Step-by-Step Guide on How to Set Up and Optimize Conversion Path Analysis
How to Improve Web Conversion Rate: Marketing & Technical Best Practices
Improving your website’s conversion rate is not about guessing what users like. It’s about combining solid marketing principles with reliable technical infrastructure. Below are the most effective, data-backed ways to raise your conversion rate sustainably.
1. Simplify the User Experience (UX)
Every additional click or step reduces the likelihood of conversion. A seamless experience keeps visitors focused on the goal.
Practical Steps:
- Keep navigation clean and predictable.
- Reduce form fields to only essential information.
- Make CTAs clear, visible, and action-oriented (e.g., “Start My Free Demo”).
Ensure mobile responsiveness, as over 62.5% of online sessions now start on mobile devices.
2. Align Messaging and Offer Relevance
A clear message helps users understand value instantly. If the offer or CTA doesn’t match intent, even good traffic won’t convert.
Action Points:
- Match landing page copy with ad promises.
- Use benefit-driven headlines (focus on outcomes, not features).
- Personalize CTAs based on visitor behavior using Ingest ID data.
3. Build Trust and Reduce Anxiety
Users hesitate when they lack confidence in your brand or process. Adding trust signals removes that friction.
Trust Builders:
- Highlight reviews, certifications, and testimonials.
- Offer transparent pricing and refund policies.
- Use visible security icons during checkout.
4. Use A/B Testing to Validate Improvements
Never assume, test. Conversion optimization requires controlled experimentation.
Best Practice:
- Test one variable at a time (CTA, image, layout).
- Run tests long enough to reach statistical significance.
- Measure results through a consistent tracking setup like Event IQ.
Tip: Even small UX changes (like adjusting CTA color or button copy) can deliver measurable conversion uplifts when validated with clean data.
5. Optimize Site Performance
Speed impacts conversion directly. Google data shows that pages taking over 3 seconds to load lose 53% of mobile visitors.
Action Steps:
- Compress images and enable lazy loading.
- Use caching and CDN support.
- Audit scripts and tags regularly. Tools like Ingest IQ make this process easier by centralizing and managing tags server-side.
6. Improve Targeting and Segmentation
Not all visitors have the same intent or value. Personalized messaging based on accurate data leads to higher conversion potential.
Ways to Apply:
- Segment audiences by behavior, source, or device.
- Create dynamic landing pages tailored to visitor type.
- Use Ingest ID to unify visitor identity and personalize experiences across sessions.
7. Analyze and Act on Real-Time Data
Continuous optimization depends on visibility. Use real-time analytics to identify sudden drop-offs, campaign misfires, or performance gaps.
How to Do It:
- Track event-level interactions using Event IQ.
- Connect insights directly to marketing platforms for instant adjustments.
- Use dashboards to compare channel performance daily.
Also Read: How to Create High-Converting Conversion Pages
How Ingest Labs Help Boost Accuracy and Results
Even the best conversion optimization strategies fail if the data behind them is incomplete or inaccurate. Many businesses unknowingly base their decisions on flawed numbers due to cookie loss, ad blockers, or inconsistent tag setups.
This is where reliable, privacy-first tracking infrastructure makes all the difference.
Ingest Labs provides marketers with a data foundation that ensures every conversion is recorded correctly, even in a cookieless environment.
| Challenge | Traditional Setup | With Ingest Labs |
| Cookie loss and browser restrictions | Missing conversions and inconsistent reports | Ingest IQ captures server-side events reliably |
| Multiple disconnected systems | Fragmented data and double-counting | Event IQ consolidates data across platforms |
| Cross-device tracking issues | User journeys break between sessions | Ingest ID links actions to a unified user profile |
| Privacy and compliance risks | High vulnerability under GDPR / CCPA | Ingest Labs ensures full first-party, compliant tracking |
Conclusion
A web conversion rate is a reflection of how effectively your website turns visitors into measurable business results. Knowing your rate helps identify what’s working, what’s not, and where to focus your optimization efforts.
Improving conversion rate depends on a balance of user experience, data accuracy, and smart tracking infrastructure. Marketing teams that rely only on surface analytics risk missing critical insights hidden in untracked or fragmented data.
That’s where Ingest Labs becomes an essential part of the equation.
- Ingest IQ ensures every conversion event is captured server-side, unaffected by browser restrictions.
- Event IQ provides real-time analytics to monitor and optimize campaign peIngest ID connects user actions into unified profiles for more precise attribution and personalization.
Together, these solutions give you the visibility and confidence needed to measure true performance and improve conversions continuously, ethically, accurately, and at scale.
Ready to see how accurate tracking improves your conversion performance?
Contact Ingest Labs to start turning data into measurable growth.
Frequently Asked Questions
1. Does a higher traffic volume always mean a better conversion rate?
Not necessarily. High traffic can bring many visitors, but if those visitors don’t match your target audience or the site experience is poor, the conversion rate may remain low or even drop. Conversion rate depends on relevance, user intent, and user experience, not just volume.
2. Can I compare conversion rates across industries or websites directly?
No, comparing blindly across industries is misleading. What’s considered “good” conversion varies significantly depending on industry type, traffic source, purchase complexity, and target audience. Benchmarks can give a starting point, but your own historical data is the best reference.
3. Do conversion rates captured by browser-based tools always reflect real performance accurately?
They may not, especially in scenarios with cookie-blocking, ad blockers, or cross-device browsing. These limitations can lead to under-counting conversions. For accurate measurement, you need privacy-compliant, server-side, or first-party data tracking that captures all events reliably.
4. If my conversion rate drops, does that always mean something is wrong with the website design?
Not always. A drop could result from changes in traffic quality, seasonality, external factors (like marketing channel mix), or shifting user intent. It’s important to review data context, traffic source, user device, and external market conditions before concluding there’s a UX or design issue.
5. Can improving conversion rate hurt long-term metrics like average order value or lifetime value?
If you optimize for shallow/micro-conversions only (e.g., sign-ups, clicks), you might increase conversion rate but attract low-quality leads. That can lead to lower long-term value or higher churn. Always align conversion goals with business quality metrics (revenue per user, retention, customer value), not just conversion counts.