
You've spent thousands acquiring new customers through paid ads, content marketing, and outbound campaigns. They sign up, make their first purchase, and then vanish. Three months later, you realize half of them never came back. The problem isn't your acquisition strategy. It's what happens after someone says yes.
Most digital marketers focus obsessively on the top of the funnel while ignoring the revenue leak at the bottom. Customer journey retention isn't about sending occasional newsletters or birthday discounts. It's about understanding exactly where customers disengage, why they leave, and building systematic interventions at each critical moment.
This guide shows you how to map every touchpoint in your customer journey and optimize each stage for retention using frameworks that drive measurable results.
Key Takeaways
- Journey mapping reveals hidden dropout points where customers silently churn, allowing you to build targeted interventions before they leave.
- Retention success depends on measuring leading indicators like time to first value, engagement depth, and behavioral health scores rather than lagging metrics.
- First-party data powers personalized retention strategies that feel helpful rather than intrusive. Ingest ID assigns unique visitor identifiers for accurate attribution and journey reconstruction across sessions and devices.
- Retention requires orchestrating experiences across channels where customers actually engage, not just email.
- Privacy-compliant tracking builds the trust foundation that makes long-term retention possible. Ingest Labs ensures GDPR and CCPA compliance while delivering the behavioral insights you need to reduce churn.
5 Stages of a Customer Journey
Every customer moves through predictable stages from awareness to advocacy. The challenge is recognizing that most retention failures happen because marketers optimize each stage in isolation rather than understanding how experiences compound across the entire journey.
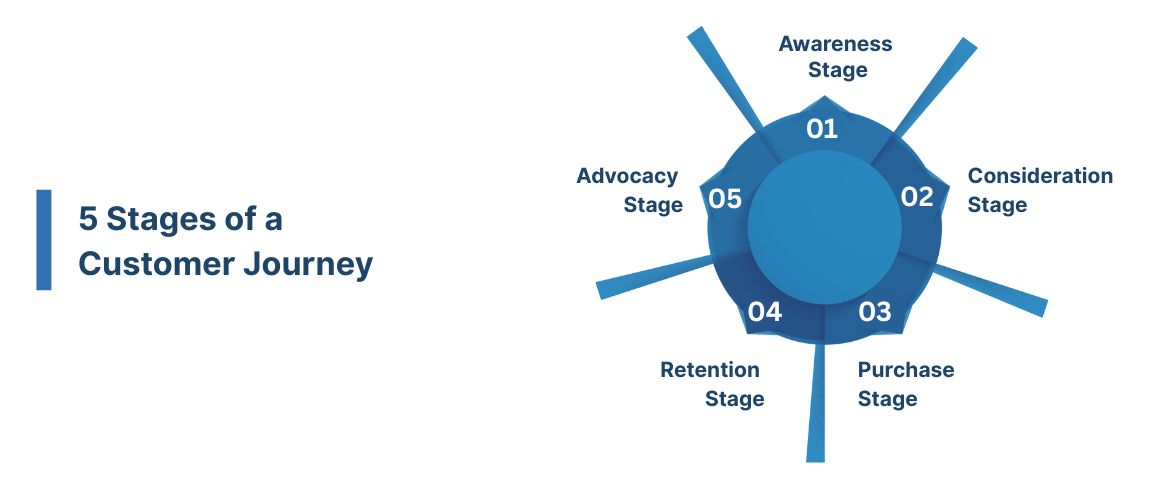
1. Awareness Stage: Where Wrong Customers Become Future Churn
The awareness stage shapes who enters your funnel. Attract the wrong audience, and retention suffers no matter how much you optimize later. This stage isn’t just about visibility; it’s about filtering for customers who will stay.
Retention starts here. If your content promises instant results but your product needs weeks to deliver value, you create an expectation gap that leads to early churn. Align your messaging with real-time-to-value to attract customers who understand the commitment.
2. Consideration Stage: Building Trust That Survives Reality
During consideration, prospects decide whether your solution truly fits their needs. They compare options, read reviews, and set expectations that directly affect retention.
Using consideration to improve retention:
- Address objections before purchase
- Be upfront about integration and implementation effort
- Acknowledge trade-offs and explain why the value is worth it
- Filter out poor fits while building trust with ideal customers
Strong consideration content doesn’t hide complexity. It surfaces challenges early, so buyers know what to expect. Customers who opt in with clear eyes stay longer than those surprised after purchase.
3. Purchase Stage: Where Friction Predicts Future Behavior
The moment someone decides to buy reveals crucial retention signals. A smooth purchase experience suggests they'll engage easily with your product. Friction during checkout often predicts friction during usage.
The hidden retention cost of purchase friction:
- Primary causes include unexpected costs and complicated processes
- Customers who struggle through checkout arrive frustrated and primed to notice other problems
- They've invested cognitive effort before experiencing any value
Reduce purchase friction not just to increase conversions but to ensure customers start their journey in a positive mindset.
4. Retention Stage: Where Customer Success Actually Happens
After purchase, customers judge your product on real experience, not promises. This stage determines renewal, expansion, or churn; everything before led here, and everything after depends on it.
Why leading indicators beat lagging metrics:
- Most companies measure retention with lagging indicators like renewal rates
- By the time someone cancels, they've been mentally checked out for weeks
- Leading indicators predict churn before it happens, creating intervention opportunities
- Track engagement frequency, feature adoption breadth, and support ticket sentiment
The retention stage isn't a single phase. It's a series of micro-moments where customers decide whether to continue investing time and money. Did the product deliver the promised outcome? Was support responsive? Did they hit obstacles that made them question the purchase decision?
5. Advocacy Stage: When Retention Becomes Growth
Satisfied customers don't just renew. They refer friends, leave positive reviews, and defend your brand in conversations. Nielsen research indicates that 92% of consumers trust recommendations from people they know over any advertising.
Why advocacy is the ultimate retention proof:
- Promoters go beyond satisfaction; they’re emotionally invested.
- Your product is embedded in their workflows, making switching costly.
- Public advocacy deepens commitment, and referred customers arrive pre-sold and more likely to succeed.
Advocacy is intentional, not accidental. It comes from creating shareable moments, recognizing contributors, and making promotion easy. Advocacy boosts retention through public commitment and brings in pre-sold customers who succeed faster.
Retention is interconnected. Awareness shapes expectations, purchase affects engagement, and retention fuels advocacy. Optimizing one stage alone misses the compounding effects that drive sustainable growth.
Also Read: The Power of Predictive Customer Analytics
What is a Customer Journey Map, and When You Should Use One?
A customer journey map captures every interaction from first awareness to advocacy, actions, emotions, pain points, and decisions. It’s not a decorative asset; it’s a diagnostic tool for retention.
Journey maps turn scattered data into a clear story. Analytics show drop-offs, support tickets show confusion, and churn surveys cite integration issues. Mapped together, these symptoms reveal where and why customers struggle.
How journey maps uncover retention risk:
- Identify compounding friction that leads to churn
- Setup issues delay time-to-value
- Delayed value reduces exploration and perceived benefit
- Predictable churn follows
Cross-functional benefits:
- Marketing aligns messaging with real customer needs
- Product spots usability issues, driving support load.
- Customer success detects churn risk earlier.
- Silos break down into a unified customer view.
Journey mapping becomes essential when retention drops without clear reasons, support volume rises, or feedback conflicts. Create maps after collecting real behavioral data, not assumptions, and base them on observed paths using tracking tools.
The most effective journey maps are living documents. Updated regularly and used for prioritization, they shift teams from reactive fixes to proactive retention design.
Also Read: User Journey Mapping: Definition, Types, and Process
6 Steps to Optimize Your Customer Journey Map for Retention
Effective journey mapping combines quantitative behavior data with qualitative customer insight. Most teams fail by skipping one or the other. Data without context misses the "why" behind behaviors. Stories without data create compelling fiction rather than actionable truth. Here's how to build maps that actually improve retention.
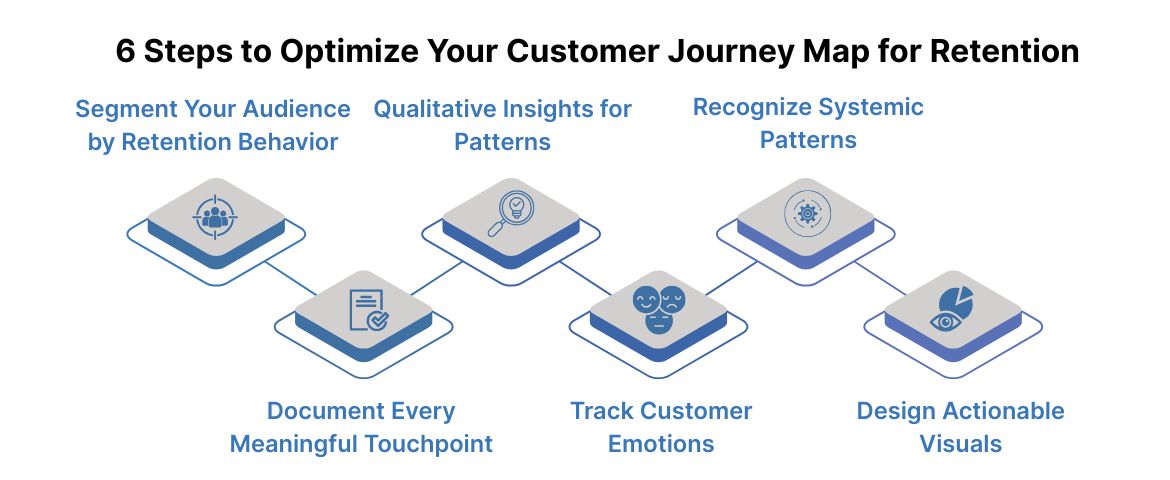
Step 1: Segment Your Audience by Retention Behavior
Customers don’t follow a single path, and treating them the same hurts retention. Power users, casual users, enterprise buyers, and high-risk accounts each need different support, expectations, and interventions.
How to segment for retention success:
- Analyze actual retention outcomes rather than demographic assumptions
- Segment based on behaviors that predict staying or leaving
- Track feature usage patterns, engagement frequency, and support interaction types
- Identify expansion signals that indicate growth potential
- Ingest ID enables analysis by tracking individual journeys with first-party identifiers
Build retention personas that guide decisions:
- Document who your highest-value segments are
- Identify what drives them to stay versus what causes them to consider leaving
- Map which interventions successfully re-engage different segments
- Use personas to guide every subsequent mapping decision
Step 2: Document Every Meaningful Touchpoint
List all customer touchpoints, but prioritize those that shape retention decisions. Focus on high-impact moments like first use, feature discovery, support interactions, billing, and value realization.
Capturing the complete touchpoint picture:
- Don't limit documentation to digital interactions only
- B2B customers make retention decisions during in-person meetings and phone calls
- Include conversations with peers that your analytics never capture
- Interview customers to discover hidden touchpoints that influence staying or leaving
Why comprehensive tracking matters:
- Server-side tracking through Ingest IQ captures touchpoints that client-side tools miss
- Browser limitations and ad blockers create visibility gaps in standard analytics
- You can't optimize interactions you can't see
- Accurate touchpoint identification requires infrastructure that works regardless of browser settings
Step 3: Gather Qualitative Context for Quantitative Patterns
Behavioral data shows what customers do; qualitative research explains why. Run retention-focused interviews to uncover near-churn moments, what kept them, and what would make them leave tomorrow.
How to extract retention insights from support data:
- Analyze support tickets for problem frequency and emotional tone
- Identify whether customers are frustrated or merely confused
- Notice if questions are phrased as exploration or complaints
- Sentiment analysis reveals engagement quality that usage metrics obscure
Reading between the lines of churn surveys:
- Customers rarely tell the complete truth about why they left
- They give socially acceptable answers like "price" when the real reason was "didn't see enough value."
- Look for patterns across multiple data sources to triangulate actual causes
- Combine survey responses with behavioral data and support history for a full picture
Step 4: Map Customer Actions Alongside Emotional States
For each touchpoint, capture actions and inferred emotions. Actions are observable, such as pricing clicks, cart abandonment, and repeated support tickets. Emotions are inferred from behavior and feedback: confused, frustrated, delighted, or indifferent.
Building the emotional timeline:
- Create a timeline showing interaction sequences
- Note decision points where customers choose to continue or exit
- Highlight pain points where frustration peaks and satisfaction dips
- Emotional valleys predict churn risk far better than usage volume alone
Spotting expectation mismatches:
- Pay special attention to gaps between expectations and reality
- When do customers expect one thing and experience another?
- These gaps create negative emotions that drive churn
- Determine if mismatches result from misleading marketing, inadequate onboarding, or unfixable product limitations
Step 5: Identify Systematic Patterns Not Just Individual Problems
Analyze journeys for recurring friction, not one-off issues. Focus on drop-offs, repeated support problems, negative feedback themes, and behaviors linked to churn. These systemic patterns justify optimization investment.
Distinguishing fixable friction from inherent complexity:
- Some pain points result from poor design or confusing interfaces
- Others reflect genuine difficulty in the problems you solve
- You can eliminate design problems through optimization
- Inherent complexity requires better expectation-setting and support rather than pretending solutions are simple
How to prioritize patterns effectively:
- Prioritize by impact and feasibility
- A friction point affecting 5% of customers might not justify major development work
- A pattern touching 40% of your customer base demands immediate attention
- Balance resource requirements against retention improvement potential
Step 6: Create Visual Representations That Drive Action
Translate insights into clear visuals that teams can act on. Use flowcharts for linear steps, swimlanes for multi-actor journeys, or emotion curves across the lifecycle, so the retention story is clear at a glance.
Making data actionable through visualization:
- Include specific data points that quantify problems
- Don't show "customers get frustrated during setup."
- Instead, show "37% abandon initial setup, 52% require support, average time-to-value is 18 days vs target of 7."
- Numbers create urgency that vague descriptions don't
Building organizational alignment:
- Share maps across marketing, sales, product, engineering, support, and leadership
- Each team should see how their decisions impact the complete journey
- Visibility builds alignment that produces consistent customer experiences
- The mapping process often reveals insights driving immediate improvements
Build incrementally, test changes based on early findings, and refine understanding as you gather more data.
However, most retention problems start with incomplete data. These gaps create blind spots where customers churn for reasons you never see coming.
Also Read: The Complete B2B Journey Mapping Guide for Modern Sellers
Stop Guessing About Customer Behavior: Track What Actually Drives Retention
You're optimizing based on fragments: website analytics missing post-purchase behavior, product usage data disconnected from marketing touchpoints, and support systems isolated from engagement metrics.
Effective retention optimization requires end-to-end visibility across the customer lifecycle, linking acquisition channels to long-term retention, onboarding paths to engagement, and behavior patterns to expansion or churn.
Traditional analytics tools were built for acquisition, not retention. They track visitors, not customers. They measure clicks, not outcomes. They report on channels, not journeys. Retention demands a different infrastructure designed specifically for lifecycle visibility.
How Ingest Labs delivers complete retention visibility:
- Ingest IQ captures complete customer behavior through server-side tracking that bypasses browser limitations, creating blind spots in standard analytics
- You see every touchpoint across every channel without gaps from ad blockers or browser restrictions
- This comprehensive view reveals the true customer journey rather than fragmented approximations
- Ingest ID provides first-party identifiers for each visitor, enabling precise attribution and deep journey understanding
- Track customers across devices and sessions without losing context
- Reconstruct complete customer stories from awareness through retention outcomes
- Transform disconnected data points into a narrative understanding that drives optimization
- Event IQ unifies data from all sources into a single intelligence platform with real-time insights
- No need for data engineers building custom pipelines or analysts running manual queries
- The platform automatically surfaces patterns predicting churn
- Identifies highest-impact optimization opportunities across your customer base
Ingest Labs provides these capabilities without coding. It handles tracking, data unification, and identity resolution automatically, letting your team focus on optimization instead of technical maintenance.
Stop accepting incomplete customer understanding as inevitable. Start tracking the complete journey with Ingest Labs to turn retention insights into measurable business growth.
FAQs
1. How do you measure customer journey effectiveness without vanity metrics?
Focus on leading indicators tied to retention: time to first value, active usage, feature adoption, support sentiment, and behavioral health scores. Pair behavior data with customer feedback and use cohort analysis to identify which journey experiences drive long-term retention.
2. What’s the difference between customer journey mapping for acquisition vs retention?
Acquisition maps optimize conversion from awareness to purchase. Retention maps track post-purchase behavior, engagement, value realization, satisfaction, and renewal over time. Retention focuses on long-term behavioral patterns, not one-time conversions.
3. How often should you update customer journey maps?
Review quarterly at minimum, and update immediately when behavior, retention, or product changes occur. Journey maps should be living tools used regularly—if they’re not referenced monthly, they’re not driving decisions.
4. Can small businesses build effective journey maps without enterprise tools?
Yes. Start with customer interviews, support logs, feedback, and basic analytics. The value comes from structured thinking, not tooling. Scale to automation only as data volume and complexity grow.
5. How does privacy regulation impact journey tracking and retention?
Privacy laws require consent, transparency, and first-party data usage. They don’t limit optimization—done right, they build trust. Customers who trust data practices engage more and stay longer.