
Customer journey visualization turns scattered touchpoints, ad clicks, and conversions into a structured story you can act on with confidence. It helps you see how prospects in the US and Canada move from first impression to renewal, across channels, teams, and platforms, into a coherent view that supports better decisions and privacy-aware data use.
This guide explains how to use customer journey visualization to reduce waste, protect budgets, and keep your data privacy-ready while you scale performance marketing. You will see how to move from gut feeling to measurable journeys, where tools like Ingest IQ, Ingest ID, and Event IQ provide a first-party, cookieless backbone for tracking behavior and connecting it to revenue.
In a nutshell
- Customer journey visualization shows how real customers move across channels and stages, from first touch to retention or churn, using connected, first-party data instead of siloed reports.
- Accurate journeys depend on first-party, consent-aware tracking, especially as cookies disappear and privacy rules tighten across the US and Canada.
- The process is operational, not theoretical: it defines a focused goal, unifies events, maps stages to actions, and layers in metrics that explain drop-offs and conversions.
- The most effective setups combine tracking, identity, and analytics, so journeys reflect real people across devices, regions, and sessions rather than fragmented channel views.
- Journey maps only create value when tied to KPIs and decision cycles, helping teams shift budget, fix friction, stay compliant, and plan growth using a shared source of truth.
What is Customer Journey Visualization?
Customer journey visualization is the process of turning customer interactions into visual maps that show stages, touchpoints, and outcomes over time. You move from spreadsheet chaos and siloed dashboards to a shared visual artifact that explains how different decision-makers move from initial awareness to long-term customer relationships.
Most teams build customer journey visualization in the form of flowcharts, funnel diagrams, or matrices that connect each step to concrete events, campaigns, and user attributes. These maps might show ad impressions, email opens, demo requests, sales conversations, and product usage, combined with consent status and identifiers to align with GDPR-style standards and US state privacy rules.
If your definition still feels vague, the benefits will clarify why it deserves a place in your marketing and analytics roadmap.
Benefits of Customer Journey Visualization
Once you draw journeys out of raw data, you can start cutting waste across your media budget and your Martech stack. This is where customer journey visualization stops being an academic concept and becomes part of revenue planning.
- You identify the stages where high-intent prospects drop off, such as checkout in US e-commerce sites or trial sign-ups in Canadian SaaS funnels, so you can fix friction instead of guessing.
- You can compare journeys of profitable customer segments with low-value segments and shift spend to the campaigns, channels, and paths that consistently produce long-term value.
- Your legal and privacy teams see how consent flows sit inside the journey, helping you honor GDPR-style expectations and North American regulations while still running effective retargeting.
- Customer journey visualization supports better collaboration across media, CRM, and product by giving teams a shared view of behavior and outcomes.
If you want these benefits to show up in your monthly reporting, you need a clear process for building the maps and keeping them current.
Steps to Visualize Your Customer’s Journey
Customer journey visualization works best when you treat it as a project with defined inputs, owners, and outcomes. These steps give you a structure that fits mid-market and enterprise teams in the US and Canada.
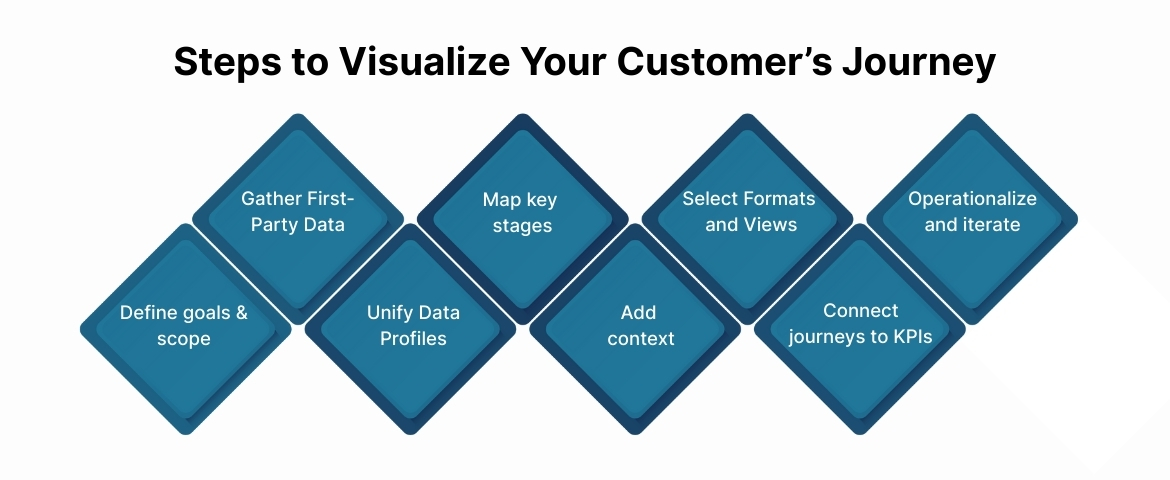
1. Define goals and scope
Start by picking a specific business outcome and segment. You might focus on “first purchase to second purchase for US retail customers” or “lead to closed-won for Canadian B2B accounts.”
Agree on a narrow scope so your first customer journey visualization produces concrete actions instead of an oversized, unused map. For example, you could focus on cart abandonment for one product line, or on trial-to-paid for one SaaS plan, and then expand over time.
2. Collect first-party data across touchpoints
Your next move is to audit the events and identifiers you already collect. That includes website behavior, app usage, CRM status, email engagement, paid media events, and offline touchpoints like sales calls where possible.
In a cookieless future, customer journey visualization depends on first-party data rather than third-party cookies. Solutions like Ingest IQ and Ingest ID help you capture events server-side and attach a consistent first-party ID, even when browsers restrict client-side tracking or users employ ad blockers.
If tracking gaps are limiting your journey visibility, Ingest IQ helps capture server-side events reliably while respecting consent and regional privacy rules.
3. Consolidate data into unified profiles
Once you know what events you collect, you need to stitch them into user or account-level profiles. Without that step, your customer journey visualization will fragment by channel and misrepresent how customers actually experience your brand.
A customer journey mapping platform or CDP can handle this unification by linking events to identifiers such as email, device IDs, and first-party IDs. Ingest ID and Event IQ, for example, can keep one profile for a visitor who browses on mobile in Toronto, later purchases on desktop, and then interacts with your support team.
4. Map key stages and touchpoints
With profiles in place, you can start plotting the journey. Most B2B and e-commerce journeys include stages like awareness, consideration, trial or cart, decision, onboarding, and retention.
Translate these stages into concrete events. For example, awareness might include first ad click or first organic visit; decision might include checkout complete, contract signed, or invoice paid. This gives your customer journey visualization a backbone rooted in how your systems already measure behavior.
5. Add context: drivers, blockers, and signals
Raw steps are not enough. You need to annotate your maps with metrics, friction points, and signals that matter for your business. That means adding conversion rates, time between steps, device mix, channel attribution, and known blockers like payment failures or consent declines.
This layer turns customer journey visualization into a diagnostic tool. For instance, you might see that Canadian visitors from paid social often stall at the shipping step because duties and taxes are unclear, while US visitors from email convert quickly with subscription options.
Event IQ can help you track and analyze these journey events in real time, so you can spot patterns across devices and channels without manual exports.
6. Choose formats and views for different teams
Different stakeholders need different angles on the same journey. Marketing might care about channel-specific paths; product might focus on in-app flows; leadership might want a summary view tied to revenue and churn.
User journey visualization should therefore include several layers: a high-level map of stages, a funnel or Sankey view of top paths, and more detailed path analysis for specific journeys. Many customer journey tracking tools support these options out of the box or through integrations with visualization platforms.
7. Connect journeys to KPIs and compliance
A journey map that does not connect to KPIs quickly becomes shelfware. You need to tie each stage to metrics such as ROAS, LTV, CAC, repeat purchase rate, and churn for specific regions in the US and Canada.
At the same time, your customer journey visualization must respect privacy obligations. That means checking which events rely on consent, how you honor opt-outs under CCPA in California and similar state laws, and whether your tracking setup aligns with GDPR-style standards that many global brands adopt as a baseline.
8. Operationalize and iterate
The final step is to treat customer journey visualization as a living asset. Set a cadence to refresh data, review findings, and update maps as campaigns, channels, and regulations change.
You can link updates to your planning cycle. For example, you might review journeys each quarter ahead of budget decisions, and after major regulatory updates in markets like California, Quebec, or federal changes in Canada that affect advertising and data use.
Once you have a repeatable process, the tools you choose will determine how quickly those journeys turn into decisions, so the next section looks at platforms that can support your team.
Top Tools for Customer Journey Visualization
Below are tools that support customer journey visualization from different angles. Together, they help you move from fragmented touchpoints to journeys that explain revenue, drop-offs, and growth across the US and Canada.
1. Ingest Labs – For journey data integrity and identity resolution
Ingest Labs supports customer journey visualization by strengthening the data layer beneath the map. Instead of focusing on diagrams or whiteboards, it ensures that every journey you visualize is built on complete, consent-aware, first-party data.
Customer journey maps often break down when events are missing, users appear multiple times across devices, or privacy rules limit tracking. Ingest Labs addresses these issues by capturing and unifying event data before it reaches your analytics or visualization tools.
Core capabilities:
- Server-side event collection: Capture web and mobile events reliably, even when browsers restrict client-side tracking
- Persistent first-party identity: Maintain a consistent user view across sessions and devices
- Unified event intelligence: Connect campaigns, product actions, and conversions into coherent journeys
- Consent-aware tracking: Align journey data with privacy rules across the US and Canada
When it matters:
If your journeys differ between GA4, ad platforms, and CRM, Ingest Labs gives you one reliable data backbone.
2. Google Analytics – For behavioral signals and funnel structure
Google Analytics provides the quantitative layer that informs customer journey visualization. While it does not replace mapping tools, it helps you validate where users enter, stall, or exit.
Key capabilities:
- User and behavior flow analysis
- Funnel visualization for conversion paths
- Custom reports by region, channel, or campaign
When it matters:
You use Google Analytics to ground journey maps in real behavior across US and Canadian traffic, especially when paired with server-side inputs.
3. Hotjar – For on-site friction and intent signals
Hotjar adds qualitative depth to web journeys. It shows how users behave between tracked events and why certain steps fail.
Key inputs for journey maps:
- Click, scroll, and movement heatmaps
- Session recordings
- On-page feedback and surveys
- Funnel drop-off visibility
When it matters:
You use Hotjar to explain why users abandon checkout, forms, or onboarding steps on US and Canadian sites.
4. Smaply – For structured, multi-layer journey maps
Smaply is built specifically for customer journey mapping. It helps you document journeys across stages, roles, and emotions in a structured way.
What it supports:
- Persona-based journey views
- Stakeholder and touchpoint mapping
- Emotional and effort layers
- Team collaboration
When it matters:
You need formal journey documentation that aligns product, marketing, sales, and support around the same paths.
For many teams, the most practical setup uses Ingest IQ and Ingest ID for tracking and identity, Event IQ as the customer data brain, and a customer journey mapping platform or analytics layer on top for visualization.
Once you know which tools will support the work, the next challenge is getting people to care about the maps and use them in their decisions.
How to Engage Stakeholders in the Visualization Process
Customer journey visualization only creates value if stakeholders trust it and use it. That means you need to involve them early and connect the work directly to their targets.
- Start by framing customer journey visualization around the KPIs each stakeholder owns, such as MQL quality for marketing, pipeline velocity for sales, or ticket volume for support.
- Co-create at least one journey with key leaders so they see their input reflected in the stages, events, and definitions, which builds confidence in the final map.
- Present findings in their language. For example, show the CFO how cart-level or account-level journeys relate to revenue recognition in US and Canadian markets, not just clicks and sessions.
Customer journey tracking tools gain credibility when stakeholders see journeys grounded in real customer behavior and compliance constraints.
If you need a neutral source of truth to avoid debates between channel teams, use Event IQ as the single place where campaign, journey, and consent data come together.
Once stakeholders understand the value, the next step is to make cross-functional collaboration part of your standard operating rhythm rather than occasional workshops.
Cross-Functional Collaboration in Customer Journey Mapping
You cannot build strong customer journey visualization in a vacuum. Marketing, data, product, sales, and legal all influence what you collect, what you show, and what you can act on.
- Marketing and growth teams define the key journeys and campaigns, while analytics teams shape how events and metrics are structured for accurate reporting.
- Product and UX teams interpret user journey visualization in the context of in-product behavior, spotting onboarding friction, feature adoption gaps, and support triggers.
- Legal and privacy teams ensure that event tracking and consent handling align with regulations such as GDPR, the CCPA in California, and new US state privacy laws that affect targeting and data sales.
A platform like Event IQ provides a shared environment where teams can review journeys, validate consent status, and align on acceptable data use by region.
Conclusion
Customer journey visualization gives you a practical way to connect first-party data, consent signals, and commercial outcomes over time. When you tie clear goals, structured steps, and the right customer journey tracking tools together, you move from partial channel reports to a single visual view of how customers in the US and Canada experience your brand.
By combining server-side tracking from Ingest IQ, persistent identity from Ingest ID, and unified analytics from Event IQ, you can build a privacy-conscious customer journey mapping platform that supports growth across regions, channels, and teams. Used consistently, user journey visualization becomes part of how you plan, spend, assess risk, and improve the experience you offer your best customers.
Get in touch with Ingest Labs today to build a privacy-ready customer journey visualization using first-party data, server-side tracking, and unified event intelligence across all your channels.
FAQs
1. What is customer journey visualization?
Customer journey visualization is the practice of turning customer interactions into visual maps that show how people move through stages, touchpoints, and outcomes with your business.
2. Which metrics should you track in a customer journey map?
You should track metrics that connect behavior to outcomes, including conversion rates, time between stages, LTV, CAC, churn, and ROAS by channel and region.
In North America, you should also monitor consent rates and opt-outs to ensure that your tracking and activation respect rules like the CCPA and Canadian privacy expectations.
3. How do customer journey tracking tools differ from standard analytics?
Standard analytics tools focus on sessions, pages, and events, often within a single channel or device. Customer journey tracking tools connect those events across channels, campaigns, and identifiers, then present them as journeys over time.
4. Why is first-party data so important for customer journey visualization?
First-party data is collected directly from your properties with user consent and is less affected by browser restrictions and third-party cookie deprecation.
5. How often should you update customer journey visualizations?
You should review and update customer journey visualizations on a fixed cadence, typically quarterly, or after major changes in campaigns, products, or privacy rules. Also, if tracking methods or channels change or consent behavior changes in the US or Canadian markets, journeys need refreshing.