

When visitors land on your website and leave without exploring further, that’s called a bounce. Your bounce rate measures how often this happens, and while it might seem like a simple metric, it reveals a lot about how users experience your site.
But here’s the catch: a high bounce rate doesn’t always mean your website is failing. Context matters.
In this guide, we’ll unpack what bounce rate truly means in modern analytics, how it’s measured today, what affects it, and how Ingest Labs’ first-party analytics solutions help you understand and improve real user engagement.
Key Takeaways
- Bounce rate shows how well your site meets user intent, not just how fast they leave. Context, page type, and traffic source define what’s “good.”
- GA4 redefines bounce rate. Pair it with engagement metrics to see real behavior, not misleading exits.
- Fixing slow speed, UX friction, or irrelevant content can cut bounce rate dramatically, especially on mobile.
- Ingest Labs’ first-party analytics ensures bounce data stays accurate and compliant, helping marketers act on real engagement insights.
What Is Bounce Rate? Definition, History & How It’s Measured
In web analytics, bounce rate refers to the percentage of sessions where a user visits one page and leaves without interacting further.
Bounce Rate = (Total Sessions / Single-Page Sessions) × 100
For example, if 1,000 users visit your homepage and 550 leave without clicking another page or event, your bounce rate is 55%.
Historical Context: Universal Analytics vs GA4
Under Universal Analytics (UA), a bounce was simply any single-page session, even if the visitor spent five minutes reading your content.
This often misrepresented engagement, especially for blogs or landing pages designed to deliver all information on one page.
With Google Analytics 4 (GA4), the model changed. GA4 focuses on engaged sessions, meaning a bounce now occurs only if:
- The session lasts less than 10 seconds,
- No conversion event occurs, and
- No second pageview happens.
In GA4:
Bounce Rate = 100% − Engagement Rate
This shift better reflects real user engagement rather than penalizing content-heavy single pages.
Why It’s Important
Bounce rate provides an instant health check on your site’s user experience, content relevance, and traffic quality. High bounce rates can indicate:
- Poor content targeting.
- Slow site speed or broken links.
- Tracking or analytics misconfiguration.
- Poor mobile experience or intrusive UX elements.
However, not all high bounce rates are negative; context (intent, page type, source) determines meaning.
Common Misconceptions
| Myth | Reality |
| A high bounce rate always means bad performance | Not necessarily, blogs, single-page sites, or knowledge bases often have high bounce but meet user goals. |
| Bounce rate equals exit rate | Bounce = one-page session; Exit = user leaves from any page. |
| You can compare bounce rates across all industries | Benchmarks vary by sector, device, and content purpose. |
| More pageviews always mean lower bounce | Not true, if users visit multiple irrelevant pages, engagement quality is still poor. |
Also Read: Bounce Rate vs Exit Rate: Key Differences Explained
Bounce Rate in 2026: What Changed with Modern Analytics
The way we measure and interpret bounce rate has evolved. In 2026, analytics platforms prioritize user engagement and interaction quality over raw page views.
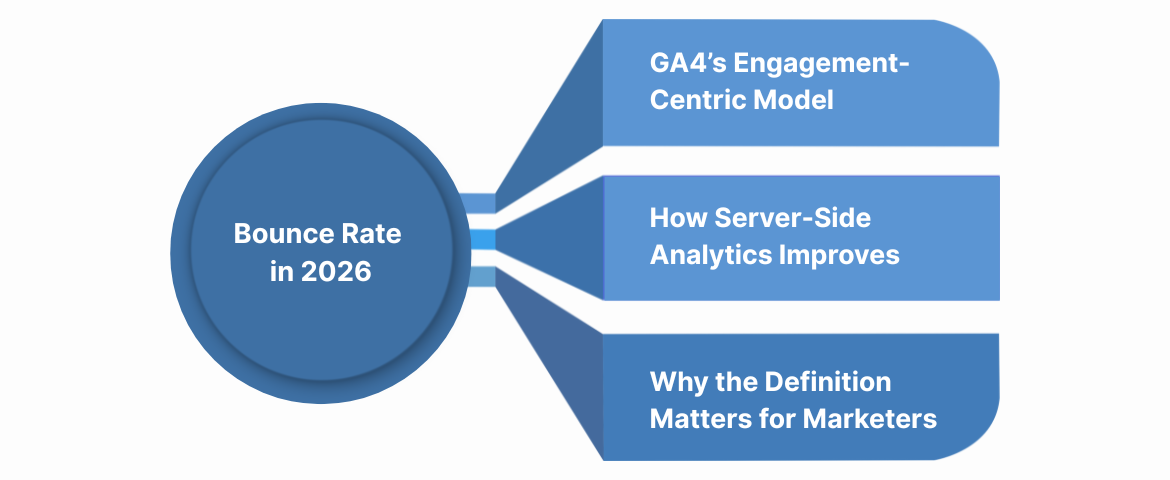
GA4’s Engagement-Centric Model
Google Analytics 4 introduced Engagement Rate, the inverse of Bounce Rate. This metric gives marketers a clearer picture of meaningful activity by focusing on sessions that show real interest.
Engaged sessions are those that:
- Last at least 10 seconds, or
- Trigger a conversion event, or
- Include two or more pageviews.
Thus, bounce rate is no longer just “visits that leave”, it’s visits without meaningful engagement.
This distinction is crucial for marketers tracking performance using tools like Ingest Labs’ Event IQ, which measures micro-interactions beyond page views (scrolls, hovers, video plays, etc.).
How Server-Side Analytics Improves Bounce Accuracy
Traditional bounce metrics rely on client-side data, meaning browser scripts must fire correctly. But with increasing use of ad blockers, cookie restrictions, and script limits, up to 20–30% of bounce data can be lost or misread.
Server-side tracking, as used in Ingest IQ, solves this by:
- Logging user events directly on your server.
- Ensuring all engagement signals are captured, even if browsers block scripts.
- Providing true bounce vs. engagement ratios without sampling errors.
Why the Definition Matters for Marketers
Knowing how your analytics tool defines a bounce is essential before making decisions.
For example:
- A high bounce rate in GA4 may mean visitors are leaving too soon or not converting.
- In server-side tracking environments, a “bounce” might include sessions where users interacted but tracking was blocked, giving false negatives.
That’s why modern marketers rely on first-party data pipelines like Ingest Labs to maintain tracking accuracy across browsers, devices, and consent models.
Also Read: How to Calculate and Reduce Churn Rate Effectively
Why Bounce Rate Matters: When It Reflects Engagement and When It Doesn’t
Bounce rate remains one of the most frequently cited and misunderstood metrics in digital marketing. It can either highlight critical engagement issues or simply reflect how well your page meets user intent.
Understanding when it matters (and when it doesn’t) is key to interpreting this metric effectively.
When Bounce Rate Reflects Poor Engagement
A high bounce rate can be a warning sign when it aligns with the following patterns:
- Short session durations: Users leave within seconds, showing a lack of interest.
- Poor traffic targeting: Visitors arrive from irrelevant ads or mismatched keywords.
- Weak content or unclear value: Landing pages that don’t answer user intent quickly.
- Bad user experience: Slow load speeds, intrusive pop-ups, or confusing layouts.
- Tracking misfires: Missing engagement signals due to faulty tag setup or cookie blocks.
These scenarios typically suggest that something in the page experience or tracking layer needs improvement.
When Bounce Rate Is Misleading
On the other hand, not every “bounce” is a failure. Some examples where a high bounce rate can be normal or positive:
- Blog articles or single-page guides: Readers find exactly what they need and leave satisfied.
- Contact or info pages: Visitors get phone numbers or locations and exit, goal achieved.
- Content-heavy knowledge bases: Designed for information delivery, not multi-page journeys.
In these cases, pairing bounce rate with time on page or scroll depth gives a more realistic view of engagement.
Why Context Matters
Bounce rate should never be analyzed in isolation. Instead, marketers should segment by:
- Device type: Mobile users typically bounce more due to slower connections.
- Traffic source: Paid or social traffic may have higher bounce rates than organic.
- Page intent: Informational content vs. transactional pages behave differently.
Example: An eCommerce checkout page with a 70% bounce rate is alarming. A blog article with the same rate may be performing perfectly.
Using Ingest Labs to Interpret Bounce Intelligently
Ingest Labs’ Event IQ platform tracks micro-interactions (scrolls, hovers, video plays) often missed by browser analytics. By capturing these server-side, it reclassifies many “false bounces” as engaged sessions, giving a truer picture of how users behave.
This allows marketing teams to move from guesswork to confidence when evaluating site engagement.
What Is a “Good” Bounce Rate? Benchmarks by Industry, Page Type, and Traffic Source
Marketers often ask: “What’s a good bounce rate?” The short answer: it depends.
There’s no universal standard; what’s good for an eCommerce site may be poor for a blog. Context, intent, and audience behavior all shape what’s acceptable.
Typical Bounce Rate Ranges
Industry research (HubSpot, Contentsquare, and GA benchmarks) shows these general bounce rate ranges:
| Website Type | Typical Bounce Rate Range | Interpretation |
| Content / Blog Sites | 60–80% | High but normal; users often find info and leave. |
| Lead Generation (B2B) | 40–60% | Indicates moderate engagement; optimize CTAs. |
| E-commerce / Retail | 25–45% | Should be low; high bounce signals friction or poor targeting. |
| Landing Pages (Paid Campaigns) | 70–90% | Often high due to a single CTA or limited navigation. |
| Service / SaaS Websites | 40–55% | Depends on the clarity of the value proposition. |
Sources: Contentsquare Digital Experience Benchmark, HubSpot Marketing Data Report.
Traffic Source Influence
Bounce rates also vary widely by traffic channel:
| Traffic Source | Average Bounce Rate | Notes |
| Organic Search | 40–60% | Usually, strong engagement occurs when content matches intent. |
| Paid Search / Display Ads | 55–70% | Often higher; it depends on ad targeting and landing page quality. |
| Social Media | 60–80% | Visitors may skim content and exit quickly. |
| Direct / Email Traffic | 35–50% | More loyal visitors typically have a lower bounce. |
Understanding this helps you identify where engagement is breaking down: the ad, the page, or the user expectation.
Device and Region Impact
- Mobile bounce rates average 10–20% higher than desktop due to speed and design constraints.
- Geographical differences also matter; audiences in regions with slower connectivity or mobile-dominant use often bounce more.
This makes technical optimization (Core Web Vitals, responsive design, caching) as important as content relevance.
Setting Your Own Benchmarks
Rather than chasing generic numbers, businesses should establish personalized bounce rate benchmarks using:
- Historical performance data from analytics platforms.
- Comparisons between similar page types (e.g., product vs. blog).
- Segmentation by traffic source and region.
Over time, trends matter more than absolute percentages. A steady decline in bounce rate or an increase in engagement rate signals genuine improvement.
With Ingest IQ’s server-side tracking, you can measure true engagement rates unaffected by cookie loss or browser restrictions. This ensures your bounce rate benchmarks reflect actual user behavior, not data gaps or tracking errors.
Benefits include:
- Cross-device consistency through Ingest ID.
- Real-time trend monitoring via Event IQ.
- Reliable first-party data storage for compliance and auditability.
The result? A bounce rate metric you can finally trust to guide decisions.
Also Read: Analyzing and Measuring Campaign Performance Metrics and Strategies
How to Analyze Bounce Rate Correctly
Analyzing bounce rate effectively requires contextual segmentation and accurate tracking. It’s not about the number; it’s about where, why, and for whom those bounces occur.
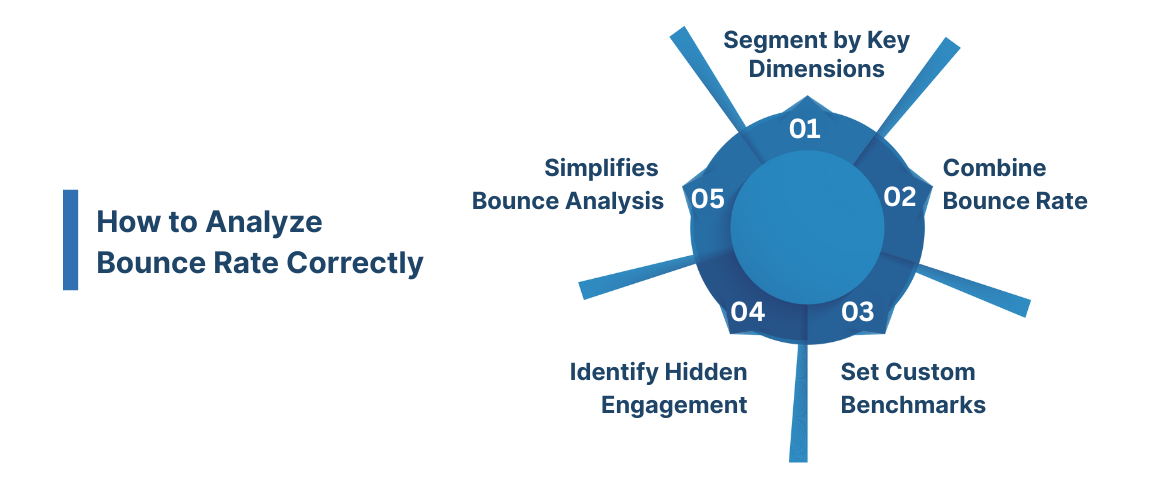
1. Segment by Key Dimensions
Segment your bounce rate by:
- Page Type: Product, landing, blog, support.
- Traffic Source: Organic, paid, social, referral, and email.
- Device: Mobile, desktop, tablet.
- Geography: Countries or regions with slower networks.
Example: A high bounce rate on paid social traffic may indicate poor ad targeting, while a high organic bounce could signal weak content alignment.
Also Read: Defining Behavioral Segmentation in Marketing with 10 Examples and Strategies
2. Combine Bounce Rate with Other Metrics
Bounce rate on its own rarely tells the full story. Pair it with these campaign performance metrics:
| Metric | What It Reveals |
| Average session duration | How long do visitors stay before leaving? |
| Engagement rate (GA4) | The opposite of bounce rate, how many sessions show real interaction. |
| Conversion rate | Whether bounces correlate with poor goal completion. |
| Exit rate | Where users drop off later in the journey. |
| Scroll depth | How far users consume content before leaving. |
This multi-metric approach highlights behavioral intent rather than superficial exits.
Also Read: Analyzing and Measuring Campaign Performance Metrics and Strategies
3. Set Custom Benchmarks
Relying on general averages can be misleading. Instead, set benchmarks using:
- Historical data: Compare performance month over month.
- Peer comparison: Use industry averages as a reference, not a rule.
- Conversion correlation: Identify which bounce changes affect real outcomes.
For instance, a 5% bounce rate increase that doesn’t affect conversions may not require intervention.
4. Use Event Tracking to Identify Hidden Engagement
Many visitors technically “bounce” even after engaging, e.g., watching a video or scrolling deeply. In Event IQ, these micro-actions can be tracked as engagement events, preventing false bounces.
Examples of measurable micro-interactions:
- Scrolls beyond 50%.
- Video plays or downloads.
- Clicks on FAQ accordions or tabs.
- Time-on-page triggers (e.g., >30 seconds).
Why this matters: Accurate tracking transforms bounce rate from a blunt metric into a diagnostic signal that truly reflects user intent.
Also Read: Event Tracking Tools for Google Analytics
5. How Ingest Labs Simplifies Bounce Analysis
With Ingest IQ and Event IQ, marketers can:
- Capture engagement events server-side (immune to cookie loss).
- Build audience segments based on actual engagement, not session drops.
- Stream clean data into analytics dashboards for real-time insights.
This approach ensures every reported bounce, or lack thereof, is rooted in real user behavior, not technical blind spots.
Ingest Labs turns bounce rate from a “vanity metric” into a conversion intelligence tool for modern marketers.
Also Read: How to Track Conversions in Google Analytics 4
Common Reasons for High Bounce Rate
A high bounce rate doesn’t happen by accident; it’s often the result of specific issues in your content, design, user experience, or analytics setup. Understanding these root causes helps teams focus their optimization efforts where they matter most.
1. Slow Page Load Speed
Page speed remains one of the strongest predictors of bounce behavior.
- 53% of users abandon a page if it takes more than 3 seconds to load.
- Even a 1-second delay can reduce conversions by up to 7%.
Causes:
- Large, unoptimized images or videos.
- Poor server response time.
- Excessive third-party scripts (ads, tags, or plugins).
2. Poor Content Relevance or Mismatched Intent
If users don’t find what they expected after clicking through, they’ll leave immediately. This mismatch often occurs when:
- The ad copy or search snippet promises something the landing page doesn’t deliver.
- Content is too generic or fails to answer the visitor’s query.
- Headlines mislead or clickbait users without fulfilling the intent.
3. Technical or Tracking Issues
Sometimes bounce rate spikes aren’t caused by poor engagement, but by analytics errors.
Common examples:
- Double-counted pageviews.
- Broken tracking code after site updates.
- Cookie-blocked sessions that go untracked beyond the first hit.
4. Weak User Experience (UX)
Visitors leave when friction outweighs value. Typical UX culprits include:
- Confusing layouts or cluttered navigation.
- Intrusive pop-ups or autoplay videos.
- Poor mobile responsiveness.
- No visible next-step CTA or internal linking path.
5. Insufficient Trust Signals
New users decide within seconds whether your site feels trustworthy. If your design or messaging feels outdated or unclear, they bounce fast.
Add trust through:
- SSL certificates and HTTPS.
- Clear contact details or reviews.
- Professional branding and consistent tone.
- Transparent data collection notices (key for compliance).
A well-designed, privacy-transparent website improves engagement and brand trust, reducing unnecessary bounces.
6. Overly Aggressive Advertising or Pop-Ups
Interruptive marketing elements often cause visitors to leave immediately.
Examples:
- Auto-playing video or audio.
- Large entry pop-ups before content loads.
- Too many banner ads.
Fix: Keep experiences light and fast. Delay pop-ups until after engagement (e.g., scroll or time triggers).
7. Device and Connectivity Limitations
Mobile visitors bounce more often due to slower load times, smaller screens, and short attention spans.
Also Read: How to proactively monitor for Tag Errors
Actionable Ways to Improve Bounce Rate
Reducing bounce rate requires a balance of content optimization, UX enhancement, technical tuning, and accurate data measurement.
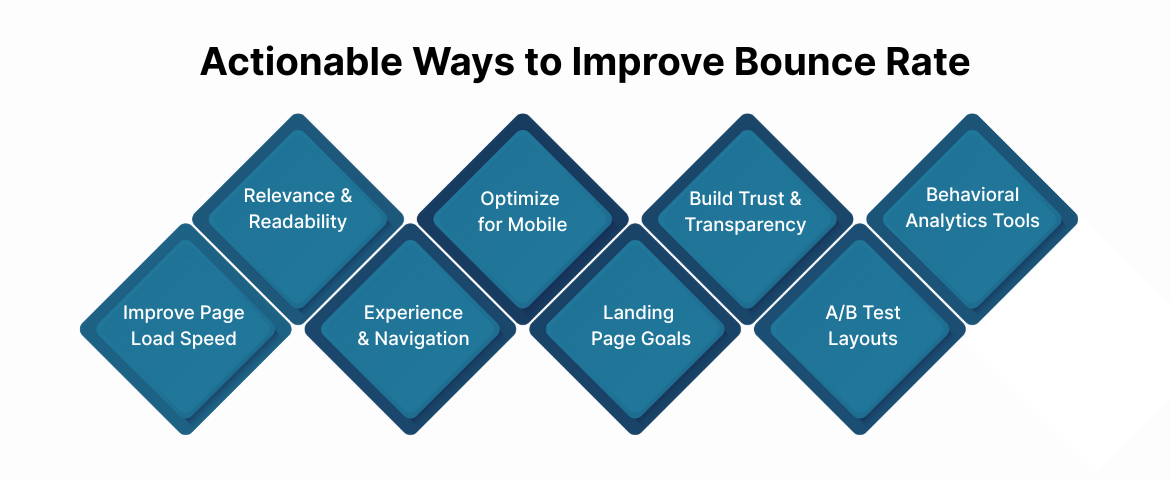
Here’s a structured approach every marketing team can implement.
1. Improve Page Load Speed
A fast website keeps visitors engaged from the first second.
Quick improvements:
- Compress and lazy-load images.
- Remove unused scripts and CSS.
- Use CDN and caching for faster delivery.
- Shift third-party scripts (ads, analytics) to server-side tagging with Ingest IQ.
Even small speed gains (0.5–1 second) can significantly lower bounce rates, especially on mobile.
Also Read: Site Slowing Down? Strategies to Improve Pagespeed with Google Tag Manager
2. Strengthen Content Relevance and Readability
Content is often the biggest factor behind engagement. If visitors don’t find immediate value, they leave.
Checklist:
- Keep headlines clear, keyword-aligned, and promise-driven.
- Write concise intros (50–80 words) that explain “what’s in it for the reader.”
- Use subheadings, bullet lists, and short paragraphs (3–5 lines max).
- Update outdated pages regularly; relevance affects both SEO and engagement.
Use Event IQ to analyze scroll depth and identify which sections readers skip or abandon.
3. Improve User Experience and Navigation
Smooth navigation increases page interaction and session duration.
Key actions:
- Keep menus consistent and visible.
- Use a clear visual hierarchy and intuitive layout.
- Add internal links to related pages or resources.
- Limit intrusive pop-ups; trigger them contextually (after engagement).
A well-structured site not only reduces bounce but also guides users deeper into your conversion funnel.
4. Optimize for Mobile and Cross-Device Experience
With mobile traffic exceeding 60% of all visits, poor mobile performance directly raises bounce rates.
Fixes:
- Ensure all pages are responsive.
- Avoid large, unclickable buttons or overlapping text.
- Test across screen sizes and operating systems.
- Use Ingest Labs’ device analytics to monitor bounce trends across platforms.
5. Align User Intent with Landing Page Goals
One of the most common bounce culprits is intent mismatch, when what users expect doesn’t match what the page delivers.
To fix it:
- Map your keywords and ads to specific landing pages.
- Write targeted meta descriptions that accurately reflect page content.
- Use clear CTAs that fulfill the user’s intent (“Get a Quote,” “View Demo,” “Download Report”).
When user expectations match experience, bounce rates drop, and conversions rise.
6. Build Trust and Transparency
Modern visitors are privacy-conscious.
A transparent, secure site fosters engagement and return visits.
Tips:
- Display privacy compliance clearly (GDPR, CCPA).
- Use HTTPS across all pages.
- Show third-party certifications or reviews.
- Make data collection consent visible and easy to understand.
Ingest Labs’ first-party tracking ensures your analytics stay accurate without compromising privacy or user trust.
7. A/B Test Layouts and CTAs
Experimentation helps uncover what truly keeps visitors engaged.
What to test:
- Headlines and hero copy.
- Button colors, sizes, and placements.
- Page layouts and content order.
- CTA copy (“Learn More” vs. “Book a Demo”).
Track bounce differences per variant using Event IQ’s A/B analytics integrations.
8. Use Behavioral Analytics Tools
Visual tools like heatmaps and scroll tracking reveal hidden engagement signals.
Tools to try:
- Event IQ (for real-time micro-interaction data).
- Hotjar, Microsoft Clarity, or Crazy Egg (for heatmaps).
- Google Optimize (for variant testing).
Pair these with server-side data from Ingest IQ for complete, reliable engagement measurement.
Also Read: Top 10 Tools for Website Visitor Tracking and Their Uses
How Ingest Labs Help You Understand Real Bounce Behavior?
Traditional analytics depend heavily on browser-side scripts and third-party cookies, both of which are becoming unreliable. This makes bounce rate data increasingly incomplete.
Ingest Labs bridges that gap with its privacy-first, first-party data infrastructure.
| Ingest Labs Product | How It Enhances Bounce Analysis |
| Ingest IQ | Captures all engagement events directly on your server, ensuring no loss from ad blockers or cookie restrictions. |
| Ingest ID | Unifies user sessions across browsers and devices, preventing false “bounces” caused by fragmented tracking. |
| Event IQ | Monitors micro-engagement events like scrolls, hovers, and video plays to identify true engagement versus abandonment. |
By combining these, marketers gain a single, accurate, privacy-compliant source of truth for bounce rate, engagement rate, and conversion performance.
Ingest Labs doesn’t just help you lower bounce rate; it helps you understand why users leave and how to keep them longer.
Conclusion
Bounce rate is a mirror of how effectively your website engages visitors. A high rate may signal poor experience, misaligned messaging, or tracking inaccuracies. A healthy bounce rate means visitors find value, trust your brand, and interact meaningfully.
But to interpret bounce data correctly, you need complete visibility, something only first-party, server-side analytics can provide.
Ingest Labs empowers marketing teams to:
- Capture every engagement signal accurately.
- Understand cross-device user behavior.
- Maintain compliance while improving conversion performance.
Book a Demo to learn how our privacy-first data infrastructure helps businesses analyze, interpret, and act on bounce rate insights with confidence.
FAQs
1. What is a bounce rate in simple terms?
Bounce rate is the percentage of visitors who view one page on your site and leave without further interaction.
2. What is considered a good bounce rate?
For most websites, a good bounce rate is between 30% and 55%. However, blogs or informational pages may naturally have higher rates.
3. Why is my bounce rate suddenly high?
Sudden spikes often stem from technical issues, tracking errors, tag misfires, or site speed problems. Review your analytics and run a tag audit using Ingest IQ.
4. Does a high bounce rate affect SEO?
Indirectly, yes. While bounce rate isn’t a direct ranking factor, search engines may interpret consistently high bounces as poor content relevance or experience.
5. How does Google Analytics 4 calculate bounce rate?
GA4 defines bounce rate as the inverse of engagement rate, sessions lasting under 10 seconds without conversions or multiple page views.
6. Can bounce rate be reduced without changing content?
Yes, by improving page load speed, UX design, and tag accuracy. Even tracking improvements via Ingest Labs can reveal more engaged sessions.
7. Why do mobile pages have higher bounce rates?
Mobile users face slower speeds, smaller screens, and distractions. Optimizing load time, button placement, and layout can reduce bounces by up to 20%.
8. Should I track bounce rate in isolation?
No. Always analyze it alongside engagement rate, conversion rate, and time on page for a complete understanding of visitor behavior.