

TL;DR
- ROAS Definition & Formula: ROAS = Revenue from Ads ÷ Cost of Ads. It shows how much revenue is earned for each dollar spent on advertising.
- Cost Breakdown: Accurately calculating ROAS requires including all ad-related expenses, media spend, production costs, platform fees, agency fees, and attribution tools.
- ROAS vs. ROI vs. ACOS: ROAS focuses on revenue generated from ads, ROI encompasses all business costs (including net profit), and ACOS is commonly used in retail and e-commerce (ad cost per dollar earned).
- What’s a Good ROAS?: It depends on industry, profit margins, LTV, and business stage. A 3:1 ratio is a general benchmark, but expectations vary widely.
- Break-even ROAS: Helps determine the minimum return needed to avoid losses; calculated as 1 ÷ profit margin.
Have you ever wondered if your ad spending is paying off, and how much it is?
Businesses are increasing marketing budgets despite growing pressure to show clear financial returns. U.S. advertising spend jumped 7% year-over-year; yet many marketers still struggle to connect that spend to actual revenue growth. The challenge isn’t just measuring ROAS, it’s knowing how to interpret it across fragmented channels, inflated reporting dashboards, and inconsistent attribution models.
For decision-makers overseeing performance marketing, this gap between spend and clarity leads to stalled budget approvals, poor campaign targeting, and rising acquisition costs with unclear returns. If you’re tracking performance without a complete understanding of ROAS, you may be scaling inefficient campaigns or undervaluing channels that support long-term growth.
In this blog, you'll learn what ROAS means, how to calculate it accurately, what costs to include, how it compares to other metrics, and how to use it to steer smarter ad decisions.
What Is ROAS?
Understanding ROAS is crucial for any marketer seeking to optimize their campaign performance. ROAS refers to the standard or baseline ROAS a business aims to achieve from its advertising efforts.
This benchmark varies across industries and depends on factors such as profit margins, customer acquisition costs, and overall business objectives. By establishing ROAS, you can set realistic targets and measure your campaigns against these standards to gauge their success. This baseline helps maintain consistency in your marketing efforts and ensures that your campaigns contribute positively to your bottom line.
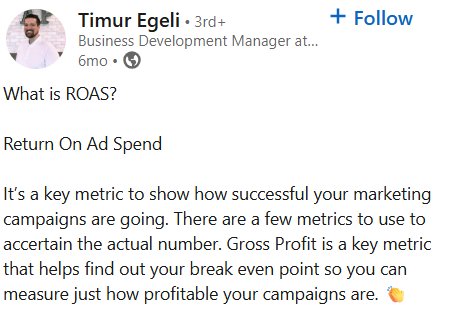
Timer Egeli has explained ROAS in his LinkedIn post:
“It’s a key metric to show how successful your marketing campaigns are going. There are a few metrics to use to ascertain the actual number.”
Also read: Understanding the Basics of paid media campaigns
Next, we’ll work through the simple calculation that turns those numbers into actionable insights.
How to Calculate ROAS
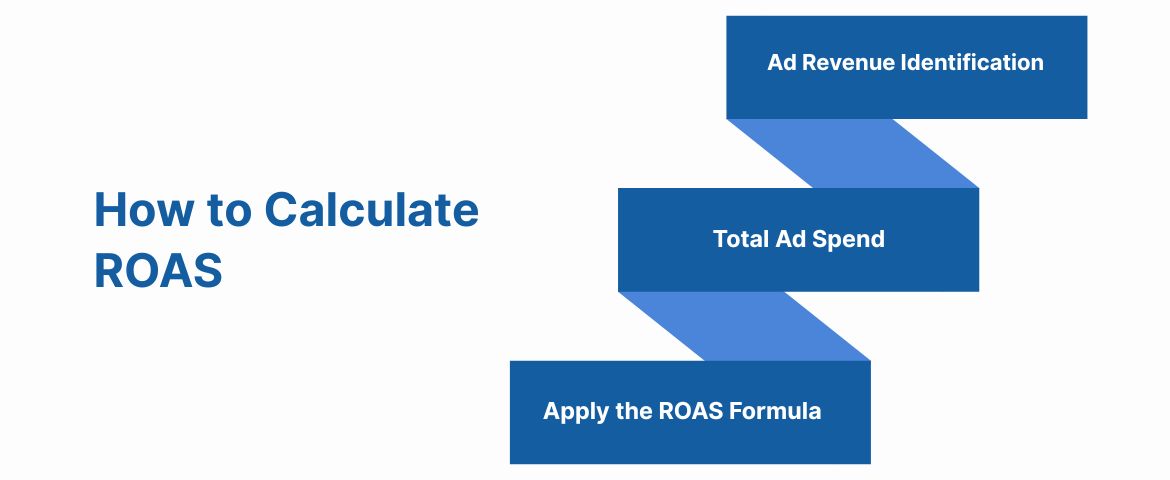
Return on Ad Spend (ROAS) tells you how much revenue you earn for every dollar you spend on advertising. It’s a simple yet powerful formula that helps you evaluate the performance of your paid campaigns.
Here are the exact steps you need to calculate ROAS accurately and apply it to your marketing performance analysis:
Step 1: Find Your Revenue from Ads
Start by identifying the total revenue directly tied to your ad campaigns. This includes income from paid search, social ads, affiliate promotions, or sponsored placements where results are trackable.
Step 2: Add Up All Advertising Costs
Your total ad cost should include media spend, creative production, platform fees, agency retainers, and any tracking tools used. Be sure to capture every expense tied to the campaign for an accurate result.
Once you have both your revenue and cost totals, you’re ready to apply the formula.
Step 3: Apply the ROAS Formula
Use this formula:
| ROAS = Revenue from Ads ÷ Cost of Ads |
For example, if you made $10,000 from a campaign that cost $2,000, your ROAS is:
$10,000 ÷ $2,000 = 5
That means you earned $5 for every $1 spent on advertising.
Now that you’ve calculated your ROAS, the next step is to determine whether your number is good and how it compares across different industries.
By consistently tracking ROAS, you can identify which campaigns are performing well and which ones need adjustments. Additionally, understanding how to calculate Return on Ad Spend (ROAS) can further enhance your ability to measure and interpret this crucial metric accurately.
To ensure accuracy in your calculations, consider using UTM Parameters and Best Practices for Tracking Campaigns to monitor the performance of each ad effectively.
Once you know how to calculate ROAS, the next question becomes: “Which costs belong in that formula?
What Costs Should Be Included in ROAS?
To calculate ROAS accurately, it’s essential to include all costs directly tied to your advertising efforts. Many marketers only count the ad spend itself, but that gives an inflated view of your return.
Here are the cost types you should always include in your ROAS calculation:
| Cost Type | Description |
|---|---|
| Ad Spend | Total amount paid to run ads (Google, Meta, etc.) |
| Creative Production | Design, copywriting, video, and media development costs |
| Platform & Tool Fees | Fees for tracking tools, landing page software, or A/B testing platforms |
| Agency or Freelancer Fees | Costs paid to external partners or consultants for managing ad campaigns |
| Affiliate Commissions | Percentages paid to affiliates or influencers based on conversions |
| Attribution Tools | Advanced platforms used to track conversions across multiple channels |
Be as thorough as possible. Underestimating costs leads to misleading ROAS numbers, and ultimately, bad budget decisions.
In the next section, we’ll compare ROAS with similar performance metrics, such as ROI and ACOS, so you know when to use each.
ROAS vs ROI vs ACOS
While ROAS, ROI, and ACOS all relate to performance measurement, they focus on different aspects of marketing spend. Understanding the differences ensures you're using the right metric for your business goal.
Comparison Table
| Metric | Stands For | Formula | Focus | Use Case |
|---|---|---|---|---|
| ROAS | Return on Ad Spend | Revenue ÷ Ad Cost | Revenue generated per dollar spent | Evaluating ad campaign effectiveness |
| ROI | Return on Investment | (Profit – Cost) ÷ Cost | Net profit after all expenses | Assessing overall business profitability |
| ACOS | Advertising Cost of Sales | Ad Spend ÷ Revenue | Cost required to make one sale | Commonly used in Amazon and retail marketing |
Key Differences
- ROAS focuses strictly on revenue from ads, not profit.
- ROI includes all business expenses—ideal for full-funnel performance.
- ACOS is the inverse of ROAS and is mostly used in eCommerce platforms like Amazon.
Use ROAS when optimizing media campaigns, ROI for financial planning, and ACOS for tight retail margins.
Also read: Understanding Multi-Channel Attribution and Its Basics
By grasping the concept of break-even ROAS, you can better align your advertising spend with profitability goals. Now that you can tell these metrics apart, you’ll want to know just what kind of ROAS counts as “good” in real-world terms.
What Is a Good ROAS?
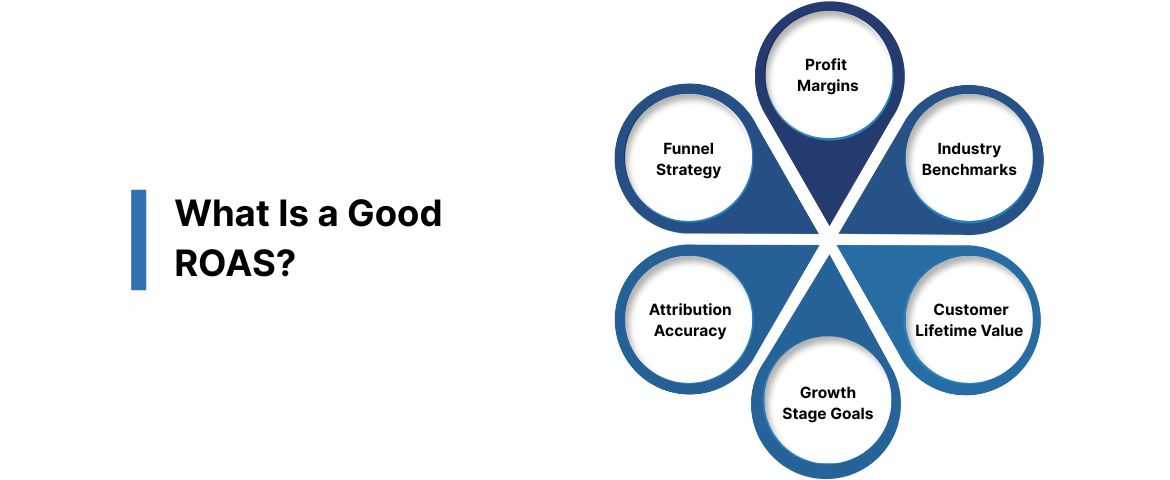
A good ROAS (Return on Ad Spend) isn’t a one-size-fits-all number. It varies based on your industry, margins, product lifecycle, and growth goals. That said, a 3:1 ROAS—$3 in revenue for every $1 spent—is often cited as a general benchmark for success.
However, to understand what qualifies as "good," you’ll need to consider the following factors:
1 Profit Margins
The higher your margins, the more flexibility you have with ad spend and ROAS thresholds.
- High-margin businesses (e.g., digital products, SaaS) can afford to run campaigns with a lower ROAS, like 2:1.
- Low-margin businesses (e.g., apparel, consumer electronics) often require a higher return on ad spend (ROAS)—closer to 4:1 or above—to remain profitable.
- Operational overhead also affects ROAS. If fulfillment or service delivery costs are high, break-even shifts upward.
2 Industry Benchmarks
Different industries have varying ROAS expectations, which are influenced by factors such as average order value, sales cycles, and acquisition costs.
- E-commerce companies typically target a conversion rate of between 4:1 and 8:1, especially if they rely on paid traffic.
- Subscription models may accept a 2:1 or lower ratio since customer lifetime value encompasses future revenue.
- B2B services often result in a lower ROAS due to higher average deal sizes and longer sales cycles.
3 Customer Lifetime Value (LTV)
LTV gives you room to invest more in acquiring customers upfront, even with a lower immediate return on ad spend (ROAS).
- If a customer spends $1,000 over time, acquiring them for $200 (a 5:1 LTV:ROAS ratio) is a sensible approach.
- Businesses with high repeat purchase rates (e.g., cosmetics, pet food) can absorb lower first-purchase ROAS.
- Consider separating ROAS for new vs. returning customers to set realistic goals across segments.
4 Business Stage and Growth Goals
Your target ROAS may shift depending on whether you prioritize growth, efficiency, or profitability.
- Early-stage businesses often accept break-even or subpar ROAS to gain visibility, data, and brand awareness.
- Scaling companies may set a moderate ROAS goal (e.g., 2.5:1–3:1) to strike a balance between growth and cash flow.
- Established brands prioritize sustainable ROAS (3:1 or higher) to maintain margins and reinvest efficiently.
5 Attribution Accuracy
Attribution affects the reliability of your ROAS numbers across different platforms and campaigns.
- Single-touch attribution may over-credit one channel and inflate your ROAS calculation.
- Multi-touch attribution provides a more complete picture by showing how all channels contribute to conversions.
- Platforms like Meta or Google often report ROAS differently—be consistent when comparing across dashboards.
6 Ad Channel and Sales Funnel
Different platforms and funnel stages yield different ROAS expectations—don’t use a single blanket target.
- Search ads (intent-driven) often yield high ROAS but have limited scale.
- Display or awareness ads may have lower ROAS, but they can build retargeting audiences and long-term brand value.
- Top-of-funnel campaigns (video, influencer) usually underperform in the short term but drive value over time.
Ultimately, a "good" ROAS aligns with your profitability and strategic goals.
Curious about your break-even point? The following section explains how to calculate the exact ROAS you need to avoid losing money.
What is Break-even ROAS (Return on Ad Spend)?
Break-even ROAS is the point at which the revenue generated from your advertising equals the cost of the ads, resulting in neither profit nor loss. It is a critical metric in digital advertising to ensure you’re not spending more than you earn. Break-even ROAS is calculated using the formula:
Breakeven ROAS=1/Profit Margin
For example, if your profit margin is 25% (0.25), the break-even ROAS is:
Breakeven ROAS=1/0.25=4
This means you need to generate $4 in revenue for every $1 spent on ads to break even.
Understanding your break-even ROAS helps you set realistic advertising goals and assess whether your campaigns are performing efficiently. Defining what qualifies as a good ROAS enables you to measure the true success of your advertising campaigns.
Even with that break-even number in mind, it’s worth remembering that ROAS doesn’t always show the full picture, especially when attribution gets complicated.
Also read: Server-Side Tagging: Why It’s Time to Shift the Game
Why ROAS Alone Can Mislead: Attribution Explained
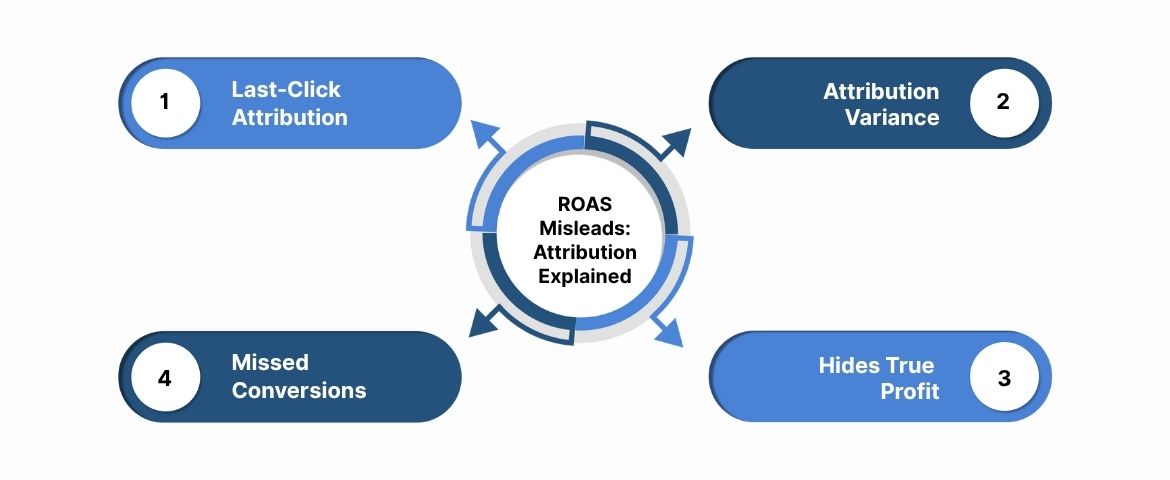
ROAS is a helpful metric for understanding how much revenue your ads generate for every dollar spent. However, focusing solely on ROAS can distort your view of actual campaign performance. It often overlooks important factors such as attribution paths, profit margins, and the long-term value of a customer.
- ROAS credits the last click: It often overlooks earlier touchpoints, such as awareness ads, emails, or social engagement, that influenced the sale.
- It varies across platforms: Google, Meta, and Amazon each use different attribution windows—this makes cross-channel comparisons unreliable.
- It doesn’t show true profit: ROAS looks at revenue, not profit. It overlooks costs such as shipping, discounts, or long-term customer value.
- It misses assisted conversions: A user might click multiple ads before converting—ROAS typically credits just one, undervaluing others.
Having a clearer view of attribution issues, it’s time to talk about how you can measure, track, and interpret your ROAS results, even if your data lives in multiple places.
Measuring and Analyzing ROAS
To effectively measure ROAS, it's essential to have robust tracking and analytics in place. Tools like Google Tag Manager Alternatives can provide comprehensive tracking capabilities, while Real-Time Data Streaming allows you to make data-driven decisions on the fly. Regularly analyzing your ROAS data helps you identify trends, uncover opportunities, and make informed adjustments to your campaigns. Additionally, understanding the differences between various attribution models, such as Multi-Touch vs. Last-Touch Attribution, can provide deeper insights into how different touchpoints contribute to your overall return on ad spend (ROAS).
Having established how to measure and analyze ROAS, let's conclude by exploring how Ingest Labs can assist you in optimizing your ROAS.
Conclusion
In summary, understanding ROAS and mastering its calculation is essential for any business aiming to optimize its advertising investments. By accurately measuring and analyzing your return on ad spend (ROAS), you can make informed decisions that drive growth, enhance profitability, and refine your overall marketing strategy. A firm grasp of ROAS empowers you to allocate your budget more effectively, precisely track performance, and strategically steer your campaigns toward success.
That’s exactly where Ingest Labs comes in. With products like Ingest IQ, you get reliable, server-side tracking that bypasses browser limitations and captures user behavior across web and mobile with far greater accuracy. Whether you're pushing data into your CDP or monitoring tags in real-time, it ensures that every insight is grounded in clean, reliable data.
Ingest ID adds another layer by assigning a durable, first-party identifier to each visitor, giving you a deeper view of the customer journey, better attribution, and more accurate ROAS tracking across platforms.
And with Event IQ, you gain a customer intelligence platform that pulls data from every source, stitches it together, and reveals actionable patterns—perfect for campaign analysis, audience segmentation, and reducing blind spots across the funnel.
Ready to take your ROAS to the next level? Contact Ingest Labs today to discover how our tailored solutions can help you unlock greater efficiency and profitability in your marketing campaigns.
FAQ
- Is a 2.5 ROAS good?
A 2.5 ROAS means you’re earning $2.50 for every $1 spent on ads. Whether that’s good depends on your profit margins. If your margins are slim, 2.5 may not be profitable, but for high-margin businesses, it could be a solid option.
- What does 400% ROAS mean?
A 400% ROAS means you earned 4x your ad spend. For example, spending $1,000 and generating $4,000 in revenue. This is generally considered strong, especially if your cost of goods sold is low.
- What is a 20% ROAS?
A 20% ROAS means you're earning only $0.20 for every $1 spent on ads. This indicates the campaign is running at a loss and needs immediate review or shutdown.
- What does 50% ROAS mean?
A 50% ROAS means you’re getting $0.50 in revenue for every $1 spent. Like 20%, it’s typically unprofitable unless part of a long-term strategy, like brand awareness.
- What is a break-even ROAS?
Break-even ROAS is the minimum ROAS you need to cover your costs—no profit, no loss. It's calculated as one divided by the profit margin. For a 25% margin, your break-even ROAS is 4.0 (or 400%).
- How often should ROAS be evaluated?
ROAS should be reviewed weekly for active campaigns and monthly for strategic decisions. Frequent checks help optimize spending before losses compound, ensuring a more effective approach.